Category: About the Journey

My Story, Current Goals, The “Omstock” Method

  • The Cost of Listening to the Noise: A Lesson in “Paper-Handed” Stops

    The Cost of Listening to the Noise: A Lesson in “Paper-Handed” Stops

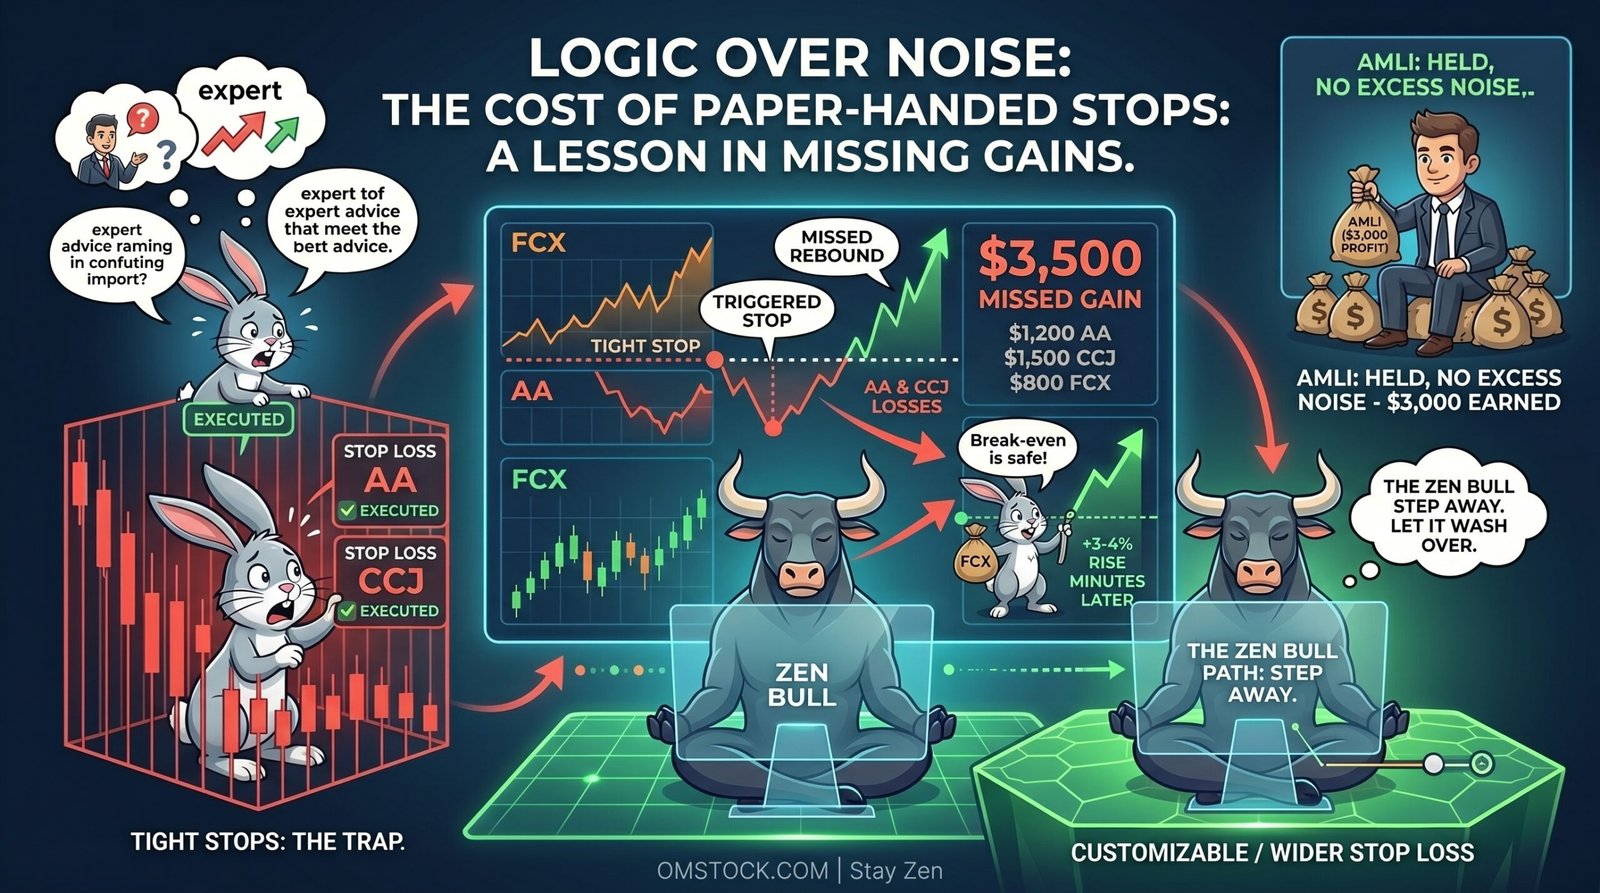
    There’s a particular pain in realizing you’re completely right about a direction, yet walking away empty-handed. That’s how I felt. I was strongly convinced about three stocks: Freeport-McMoRan (FCX), Alcoa (AA), and Cameco (CCJ). My intuition, sector research, and online sentiment all pointed toward a positive outcome. I invested $10,000 in each, expecting results within a month.

    And I was right. But I didn’t get to see the gains.

    The Trap

    Despite my instincts, I followed some “expert” advice and set my stop-losses too tight. I thought they knew better than me. I let the Paper-Handed Rabbit take control, creating a cage so small the trades couldn’t breathe.

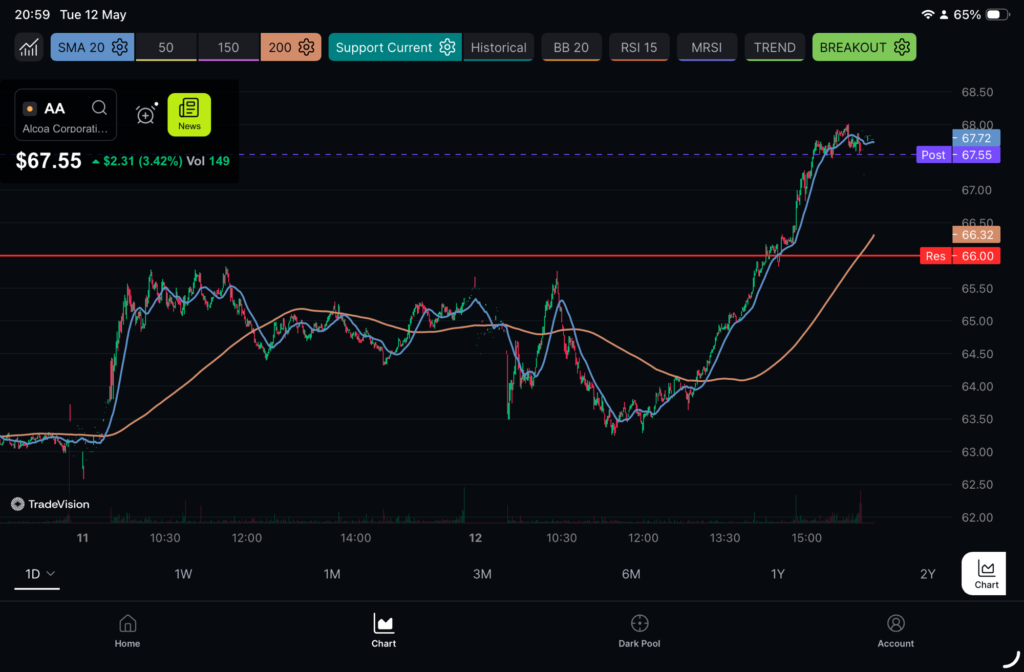
    • Alcoa (AA): Hit the tight stop early, exiting with a loss before the trend even began.
    • Cameco (CCJ): This one hurt the most — it dipped sharply, triggered my stop, then rebounded quickly. I watched from the sidelines as it soared without me.
    • Freeport (FCX): The only winner, showing a profit. But frustration with the others led me to sell just to break even.

    Minutes later, Freeport rose 3–4%.

    The Math of Frustration

    Had I not let those “experts” convince me to keep stops narrow, I’d be up $3,500 now. Instead, I’m even. Initially, that $3,500 would have been a huge boost, especially during slow work periods.

    It’s ironic. I started trading Amaroq Minerals (AMLI)—a junior gold miner in Greenland—without knowing much, through a local bank. I simply held on, invested $10,000, and earned $3,000 in a month. Back then, I didn’t “know too much.” Now, I thought I did, and the FOMO Monkey and external advice clouded my judgment.

    The Path Forward

    It’s disappointing and heavy. But instead of revenge trading or battling the market, I’m choosing the only path a Zen Bull takes: stepping away for a day or two. I’ll sit with my emotions, let them wash over me, stay with them, and release them when I’m ready. The market will still be here. Right now, I need to regain my conviction and quiet the outside noise.

    Stay Zen.

  • The Mystery of the “Jumping Stock Price” 📈🧙‍♂️

    The Mystery of the “Jumping Stock Price” 📈🧙‍♂️

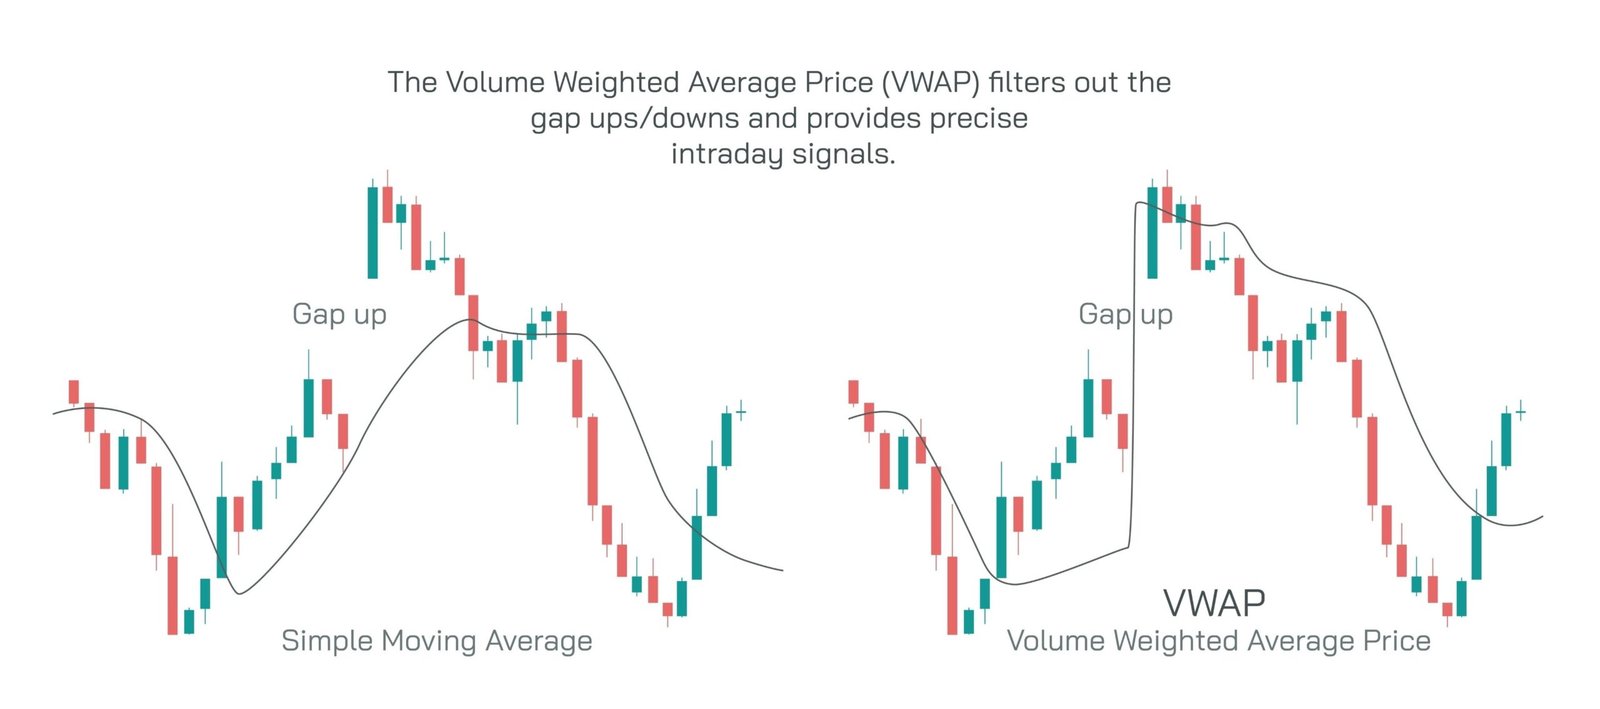
    Have you ever looked at a price tag at the store, but when you got to the register, the cashier told you it actually cost $10 more? That’s kind of what’s happening in this screenshot:

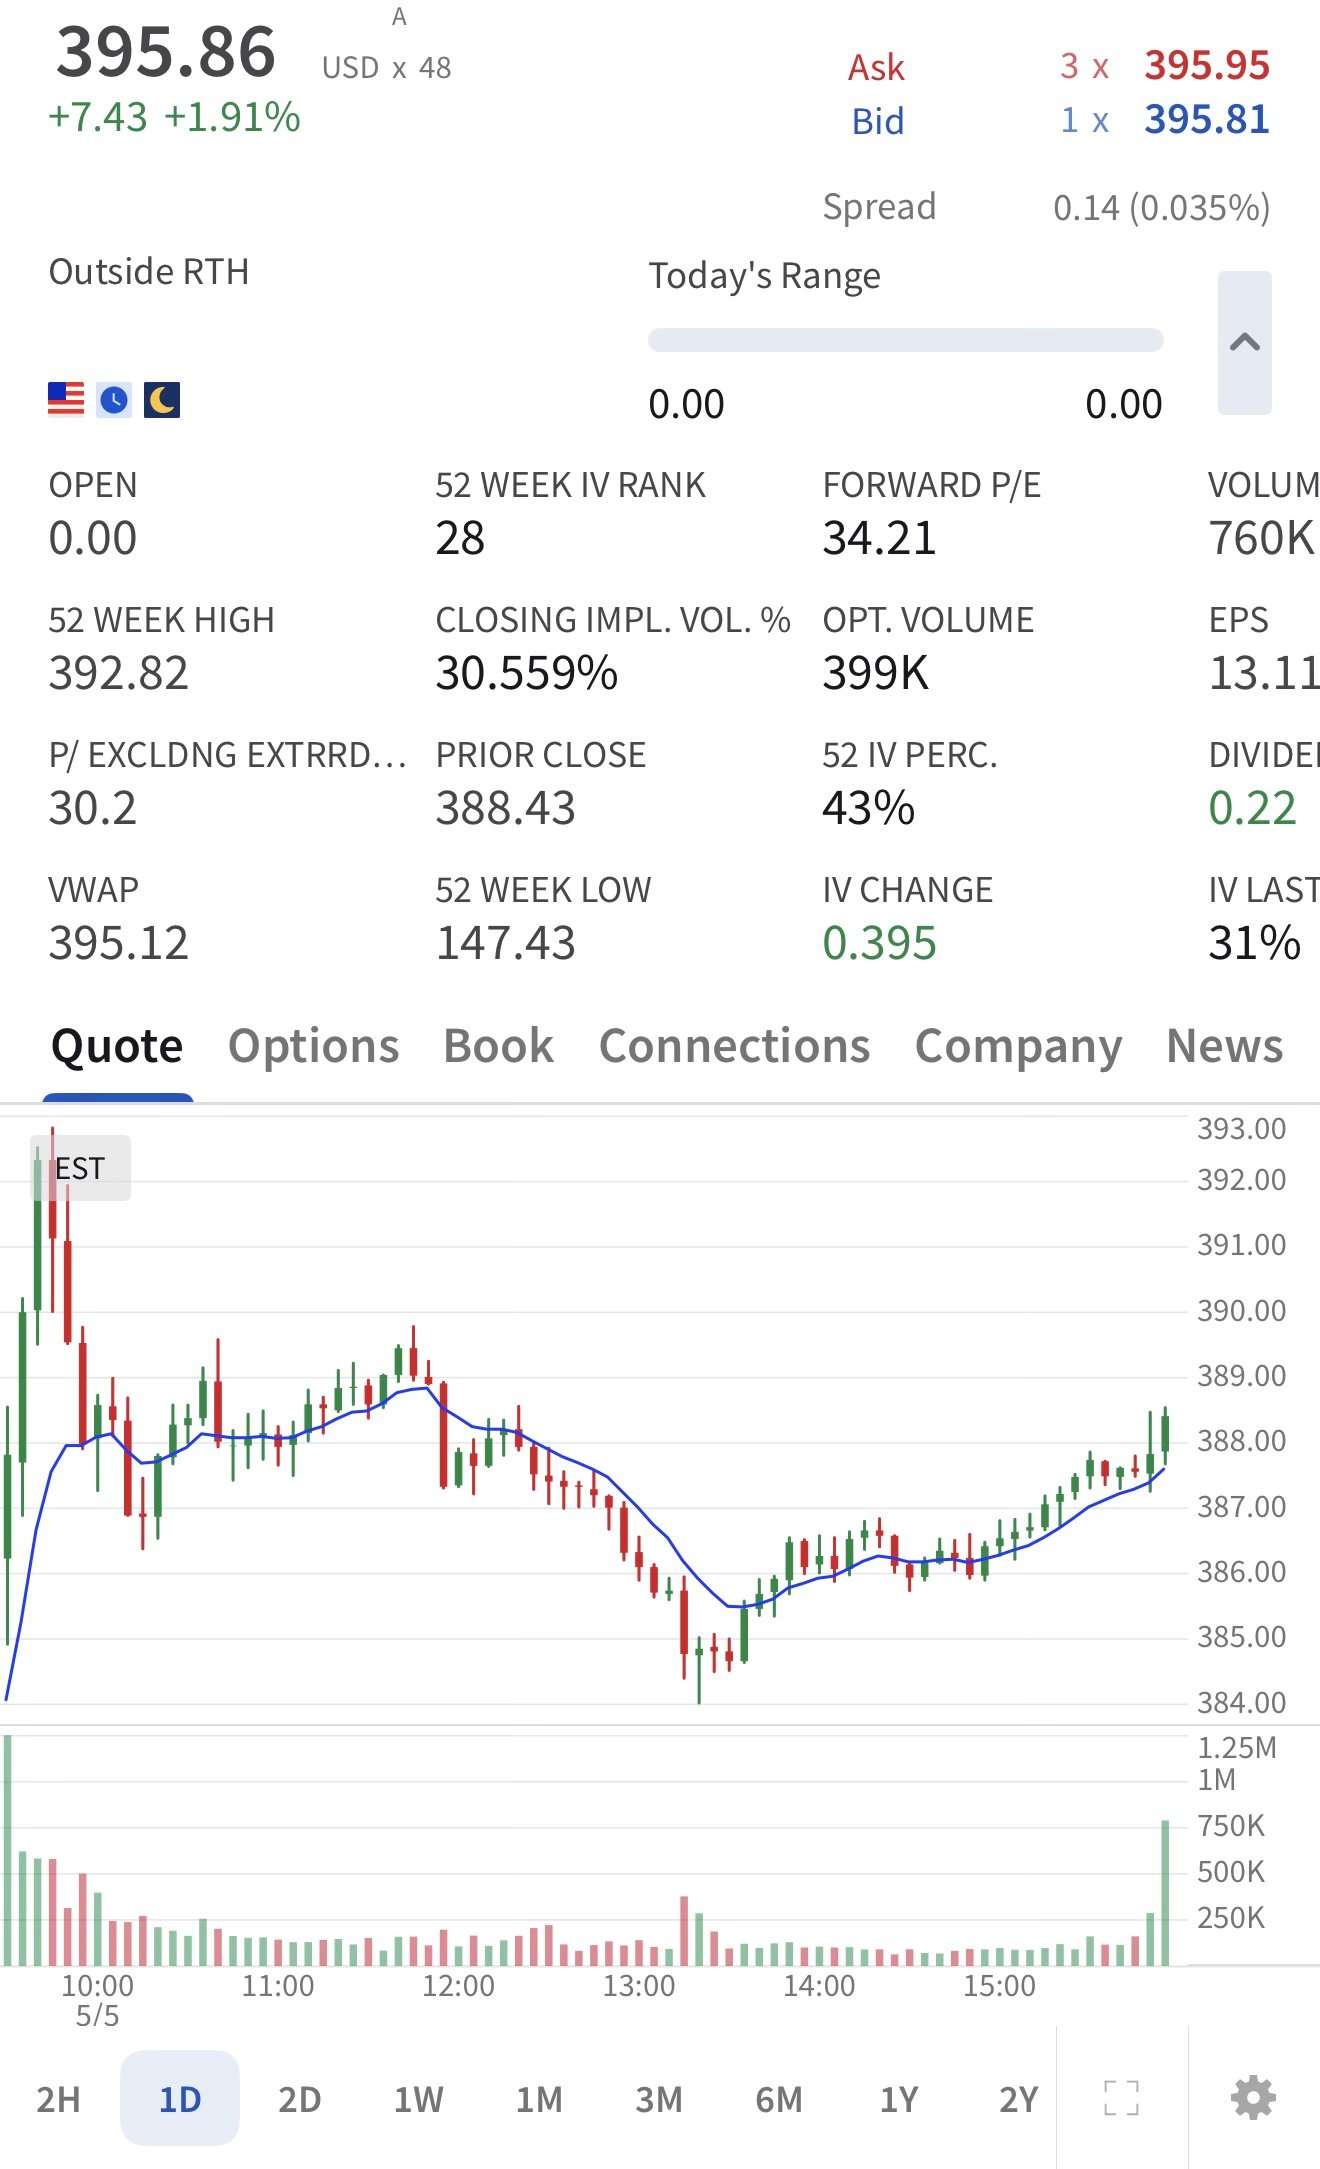
    A screenshot from Interactive Brokers shows you the gap in prices and the prices on the chart.
    A screenshot from Interactive Brokers shows you the gap in prices and the prices on the chart.

    Here is the breakdown of why the numbers look like they are playing a prank on us:

    1. The “Ghost Market” (After-Hours) 👻

    Most people think the stock market only works from 9:30 AM to 4:00 PM. But there’s actually a “secret” session called Extended Hours. In image.png, you can see a tiny label that says “Outside RTH”. This means the “Regular” market is closed, but a few people are still trading in the dark.

    2. The Big Jump (The “Gap”) 🚀

    On the chart, the price looks like it’s around 380 or 388. But the big number at the top says 395.86.

    • Imagine a video game character standing on a ledge at level 388.
    • Suddenly, while the game is “paused” overnight, the character teleports up to level 395.
    • The chart hasn’t drawn the new line yet because the official game hasn’t restarted! This is called a Gap Up.

    This chart is lagging behind. It visually ends at the Prior Close of around 388. It is still displaying the

    3. Should You Buy Right Now? 🛒

    It might seem like a bad deal to buy at 395 when the chart says 380, but here’s the deal:

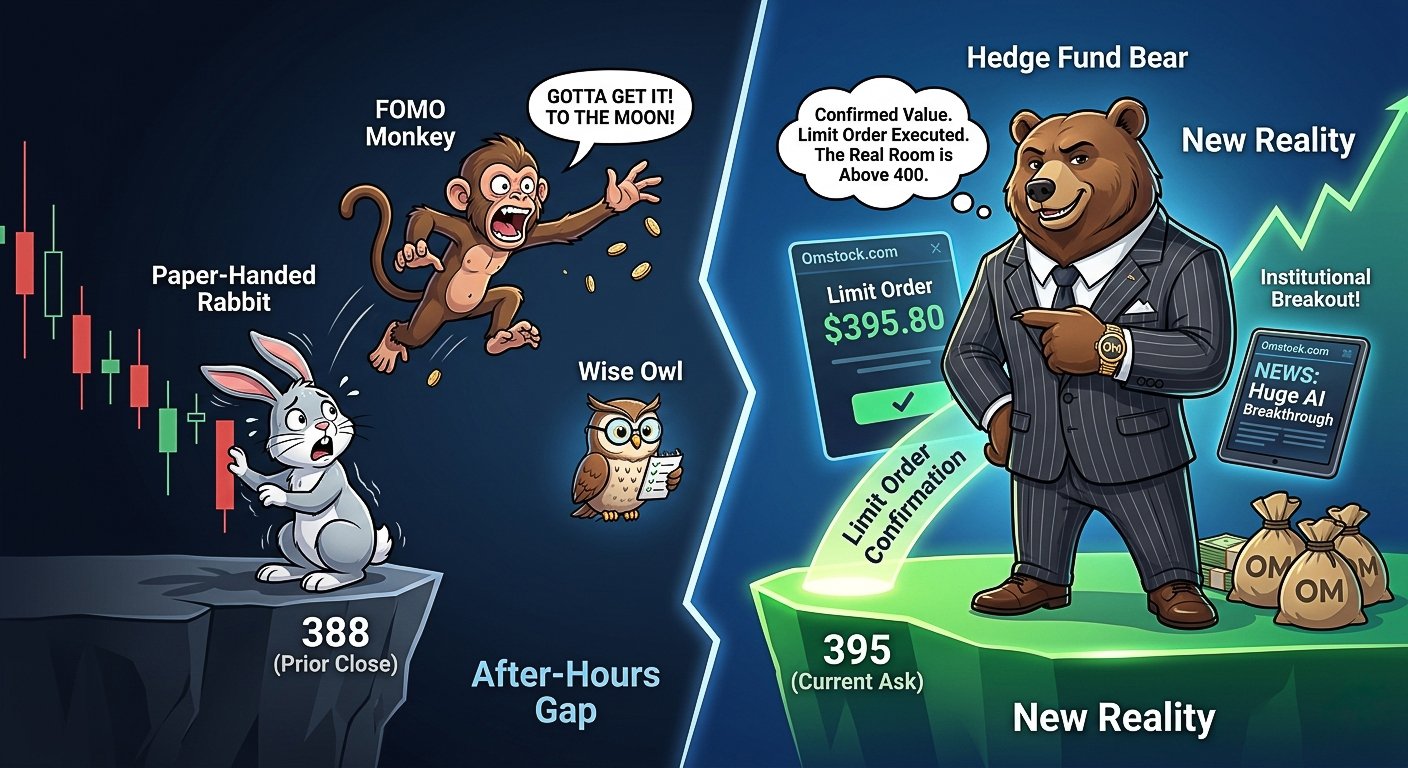
    • The FOMO Monkey 🐒: This character wants to jump in right now because they’re afraid the price will hit 400 or 500 by morning. They don’t care if they pay a little extra!
    • The Zen Bull 🐂: This character stays calm. They know that sometimes, when the market officially opens at 9:30 AM, all the excitement dies down and the price might drop back toward the old chart price.

    4. Can You Even Trade Now? 🛑

    You can, but you have to use a Limit Order. That’s basically telling the computer: “I will only buy this if the price is exactly X dollars.” If you just try to buy it normally, the computer might get confused because the “official” price is still being decided.

    The Lesson: Just because the chart shows one thing doesn’t mean that’s the price you’ll get! Always check the Ask (the seller’s price) and the Bid (the buyer’s price) before you hit that “Buy” button on Omstock.com.

    Why the “Pros” Might Buy at 395 🐳

    Even though the price jumped from 388 to 395, professional traders aren’t always just “chasing” the price. They might be buying because:

    • The “News” is Huge: Professionals might see a news report (like a big tech breakthrough) and realize that while 395 feels expensive compared to 380, the stock is actually worth 450. They want to get in before the rest of the world wakes up at 9:30 AM.
    • Arbitrage (The Price Matchers): Sometimes a stock is trading at different prices on different exchanges. Pros use super-fast computers to buy at the lower price and sell at the higher one instantly to pocket the difference.
    • Hedge Fund Math: A big “Whale” might need to buy millions of shares. They know that if they wait until the official opening bell, there will be so much “noise” and competition that they might end up paying even more than 395.
    • The “Breakout” Signal: On a chart, 395 might be a “Resistance” level. To a pro, if the price breaks above that level in after-hours, it’s a signal that the stock is now “unstoppable” and ready to fly.

    The Pro Secret: They aren’t guessing. They use advanced tools to see how many people are waiting to buy and sell behind the scenes. While the Paper-Handed Rabbit is scared of the jump, the pro sees it as a door opening to a much bigger room!

  • Holding the Line: A Tale of Two Trades

    Holding the Line: A Tale of Two Trades

    The market is showing some serious strength today, and while I almost pulled the trigger on a sale, I’ve decided to stay the course. Here’s exactly what’s happening in my portfolio right now and why I’m letting it ride.

    Freeport-McMoRan (FCX): The Morning Dilemma

    I’ll be honest—I was looking to sell Freeport today to break even. My gut was telling me we might see a dip tomorrow morning, and taking the slight win is usually a smart move. But the broader market is just too positive to ignore. With the Nasdaq and S&P hitting all-time highs today, the momentum is clearly behind the materials sector. I’m sticking with it to see if we can push even higher.

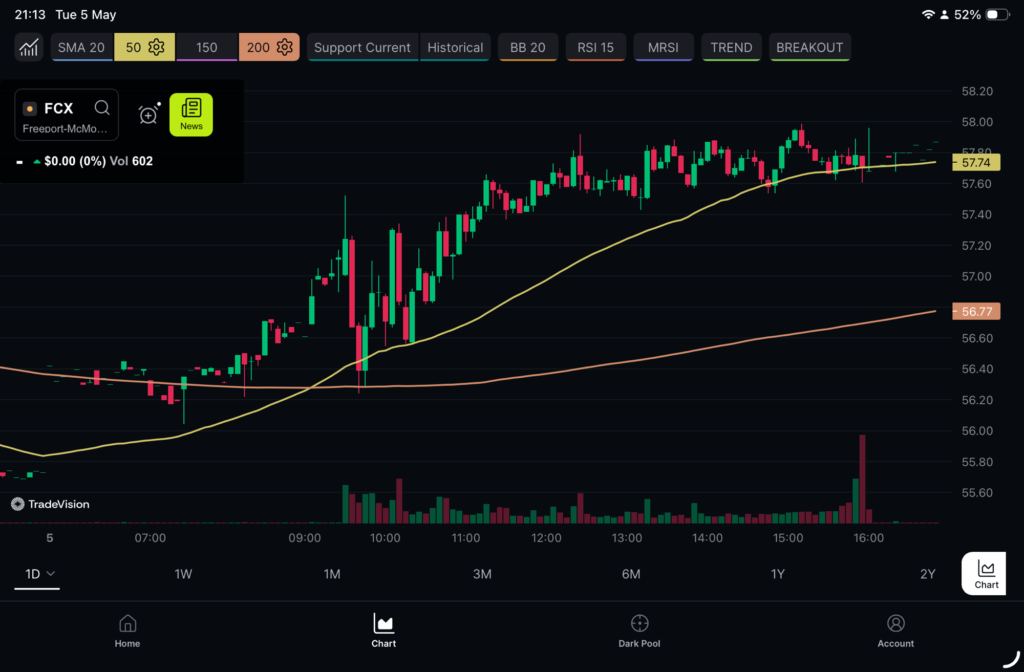
    Today was a lesson in the difference between a stock’s performance and a trader’s profit. FCX was a rocket ship, up over 4%, but because I entered my position at $57.64 last week, I only saw a total gain of 0.27%. This is the reality of trading: sometimes you have to sit through the ‘recovery’ before you get to the ‘profit.’ I’m not discouraged—the fact that I’m in the green at all after today’s volatility shows that the support levels are holding.

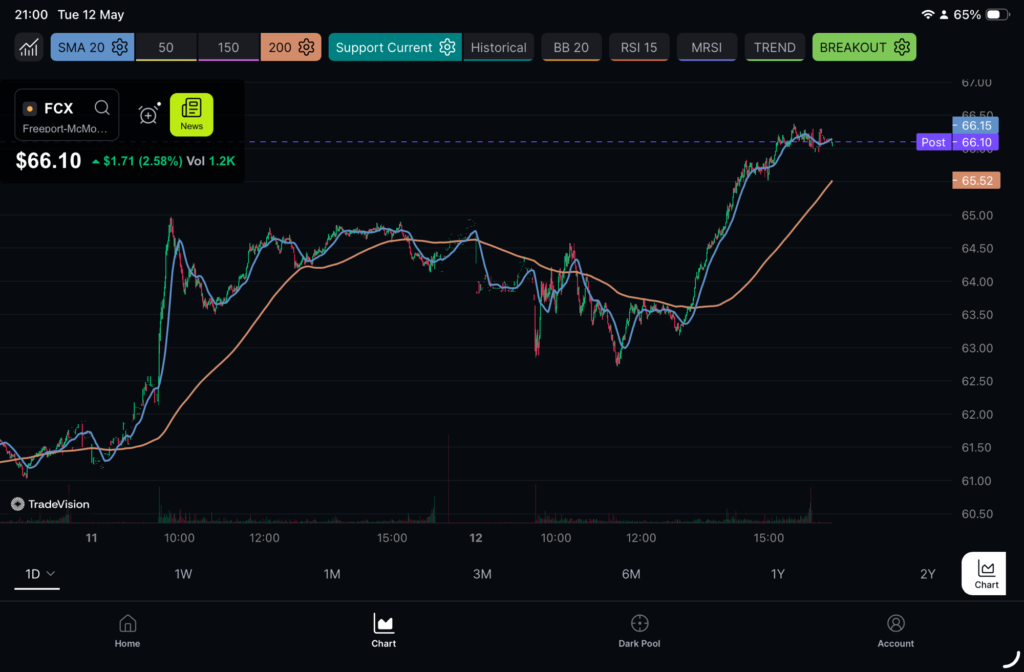
    FCX chart after the market close.

    Cameco (CCJ): The Earnings Shakeout

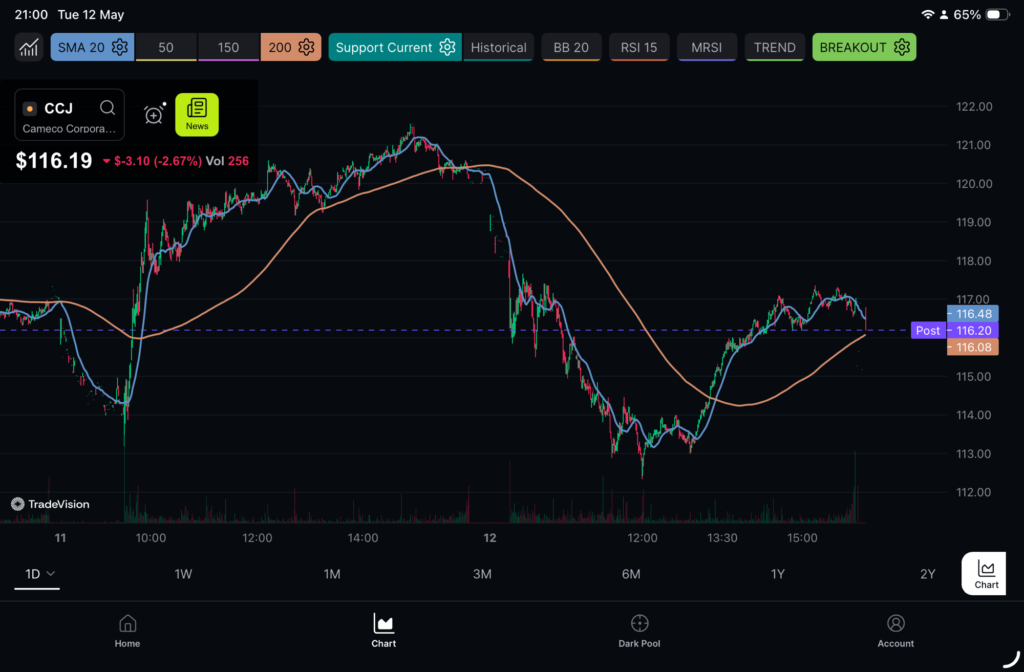
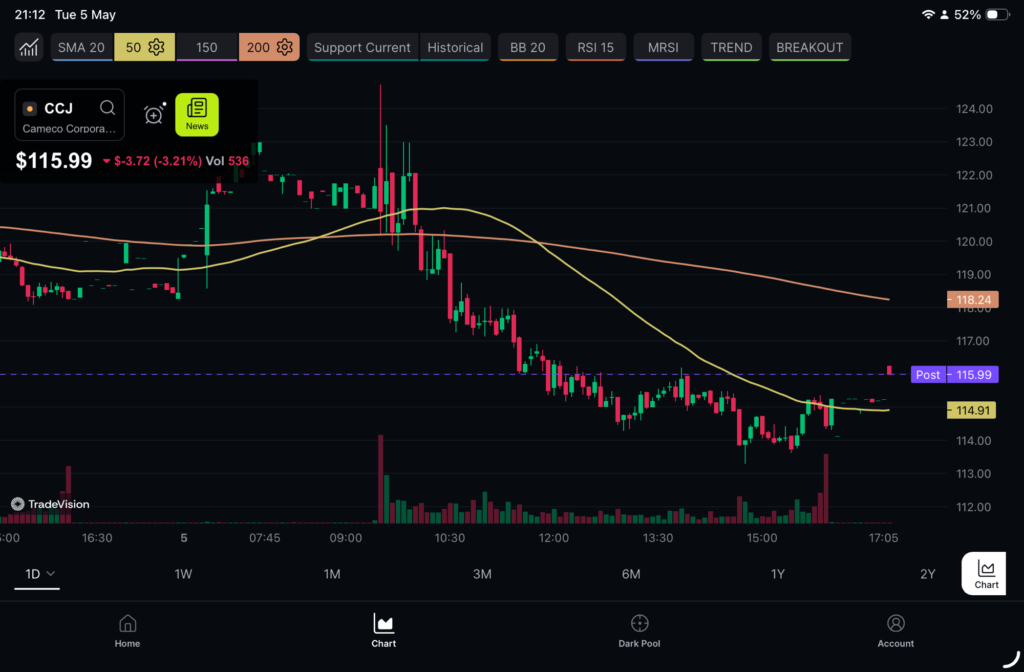
    This one was a rollercoaster. Cameco dropped its Q1 earnings this morning and it was a massive beat—nearly 30% above expectations. We saw an immediate pre-market jump to 121, but then the “sell the news” crowd stepped in and dragged it back down to the 114 range.

    A lot of traders might see that red candle and jump ship, but I’m holding my ground. My belief is that this isn’t a “crash”—it’s a shakeout. The fundamental story for uranium hasn’t changed. With countries in Europe (like Hungary and their Paks II project) pushing ahead with nuclear power regardless of EU pressure, the demand for non-Russian uranium is only going to tighten.

    CCJ chart after the market close.

    The Prediction for Tomorrow

    I’m betting that the “real money” institutions will look at today’s dip as a buying opportunity. My prediction? We see some early morning weakness followed by a steady climb in the later part of the day tomorrow as the market realizes the earnings beat was the real deal.

    The Strategy

    I’m not just trading on hope—I’ve got my stop-losses firmly in place. If the market proves me wrong and crosses my line, I’m out. But as long as the indices are breaking records and the uranium supply-demand story stays this tight, I’m staying invested.

    Let’s see what the morning brings.

  • The “Zen Bull” Gets Clipped: A Lesson in Beta and “Noise”

    The “Zen Bull” Gets Clipped: A Lesson in Beta and “Noise”

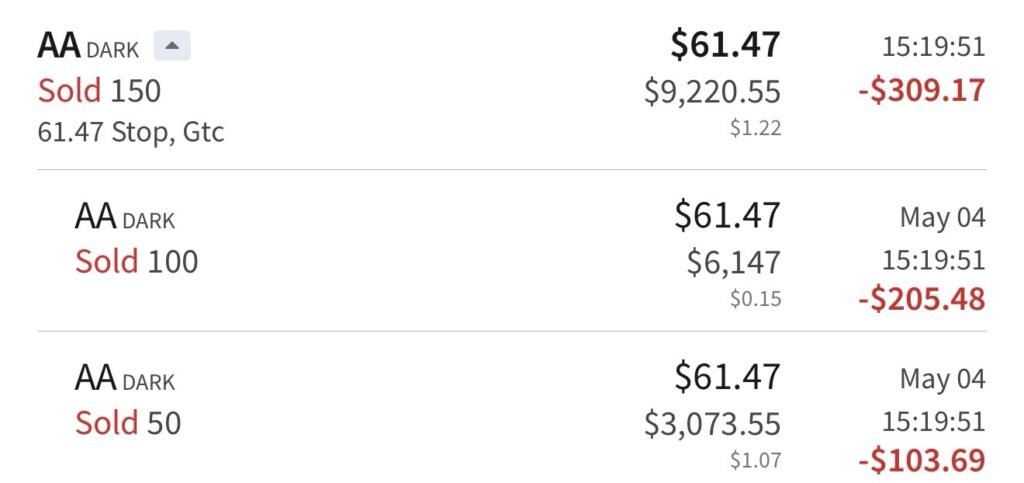
    Sometimes, the market has a way of checking your ego, and yesterday, it handed me a classic lesson. I was stopped out of my Alcoa (AA) position, and in hindsight, it was a mistake on my part. Not because the trade idea was poor, but because I overlooked the “math of the swing.”

    I was betting on a one- month recovery but set my stop loss as if I were trading a slow- moving utility stock. I forgot to consider the Beta.

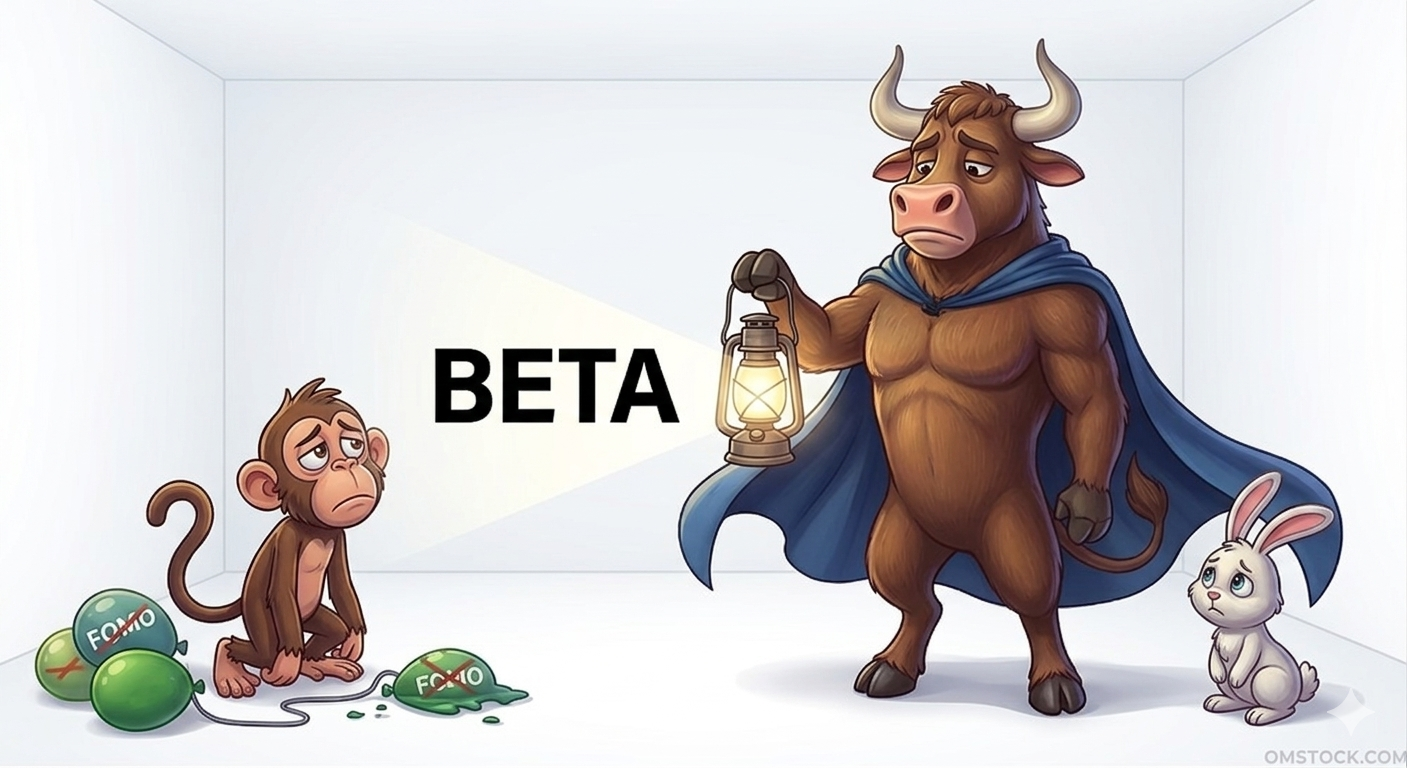
    What is Beta, and why did it affect my trade?

    In my trading experience, I usually focus on the “Zen Bull” thesis—the overall picture. But the Beta number indicates the stock’ s volatility.

    • Market Average: A Beta of 1. 1.0 means the stock moves in sync with the market.
    • Alcoa’ s Beta: AA has a Beta of 1. 7.

    This indicates Alcoa is 70% more volatile than the average stock. If the market sneezes, Alcoa catches a cold; if the market drops 1%, Alcoa could drop 1. 7%. By setting a tight stop loss on a high- Beta stock, I set myself up for a trap. The “noise” of a typical Tuesday morning was enough to trigger my exit, even though my one- month outlook was unchanged.

    The Mistake: I didn’ t give the stock enough “room to breathe.” High Beta calls for a wider safety margin.

    How to find Beta (Don’ t skip this step!)

    If you’ re using Omstock. com, avoid the same mistake. Here’ s how to find Beta before investing:

    1. Your Broker App: Many professional platforms like Interactive Brokers display Beta in the “Key Statistics” or “Instrument Details” section for any stock.
    2. Financial Sites: Visit Yahoo Finance or Google Finance, input the ticker (e. g., AA or CCJ), and find Beta listed under ” Beta (5 Y Monthly) ” on the main summary page.
    3. The “Vibe” Check: A Beta above 1. 1.5signals a “jumper”- expect larger swings.

    Moving Forward

    I won’ t let the FOMO Monkey influence me after this stop- out. I see this as a lesson for my Omstock journey. Next time, I’ ll check the Beta first and adjust my position size so I can handle a wider stop without risking too much.

    The Zen Bull remains calm, even when clipped. Onward to the next trade.