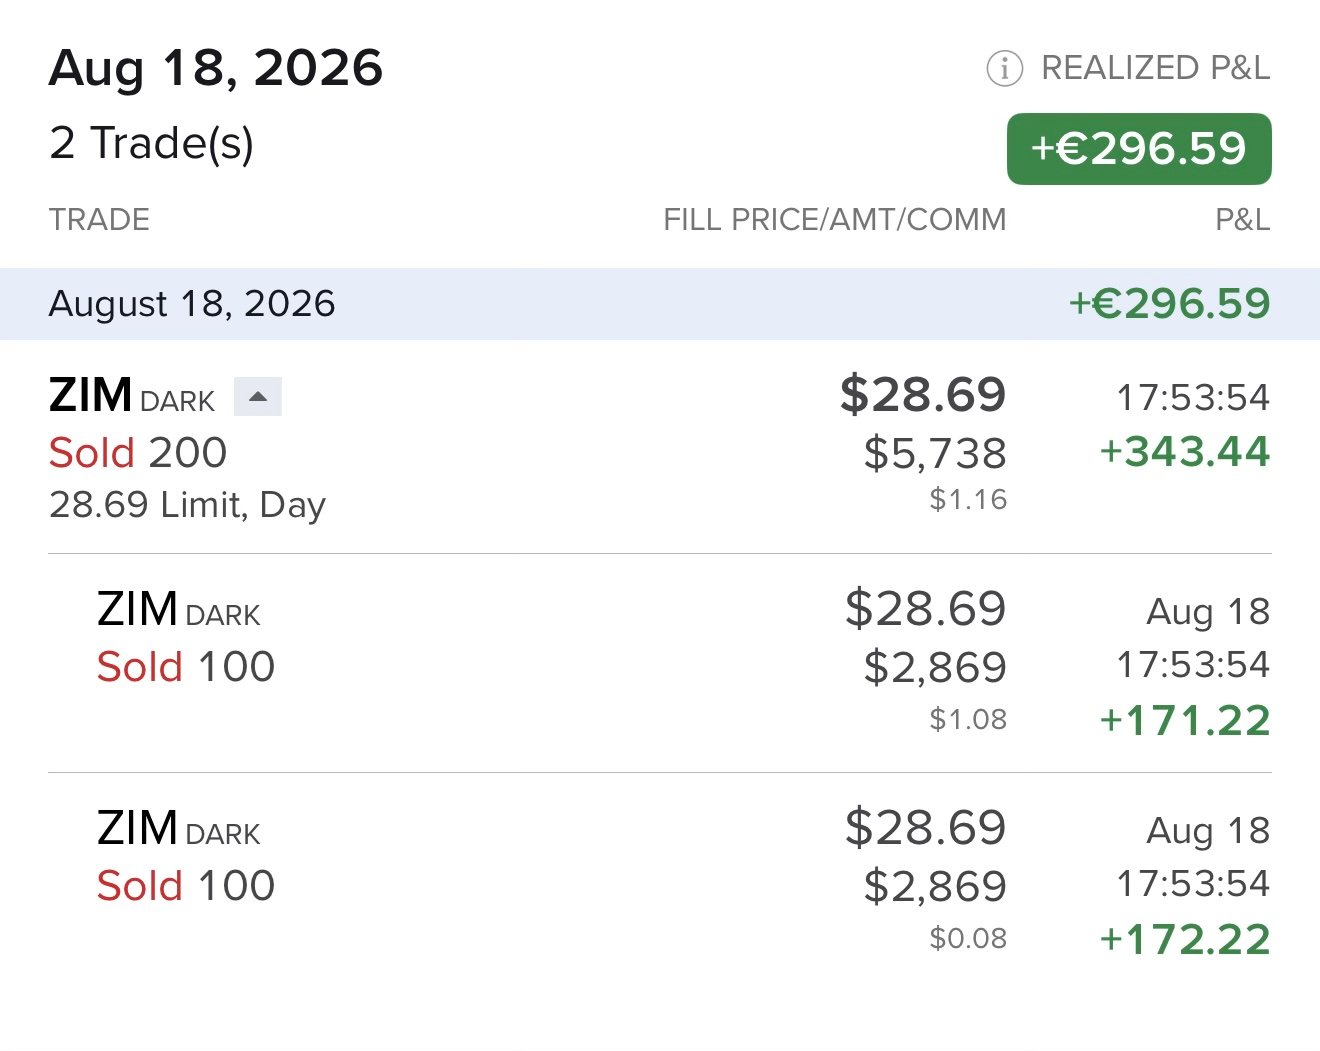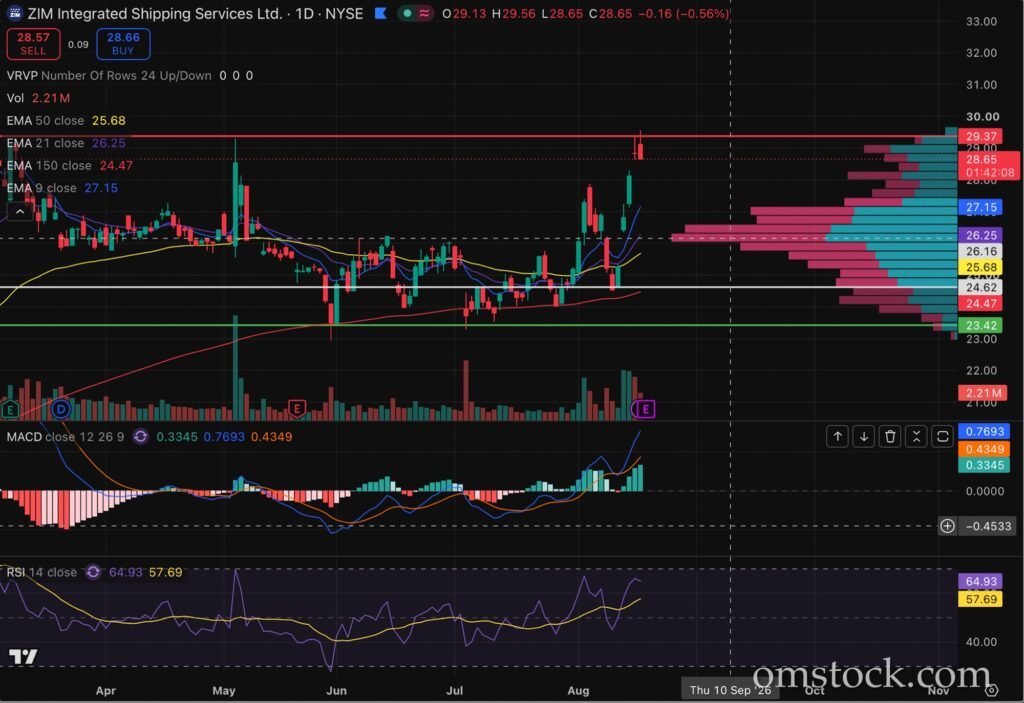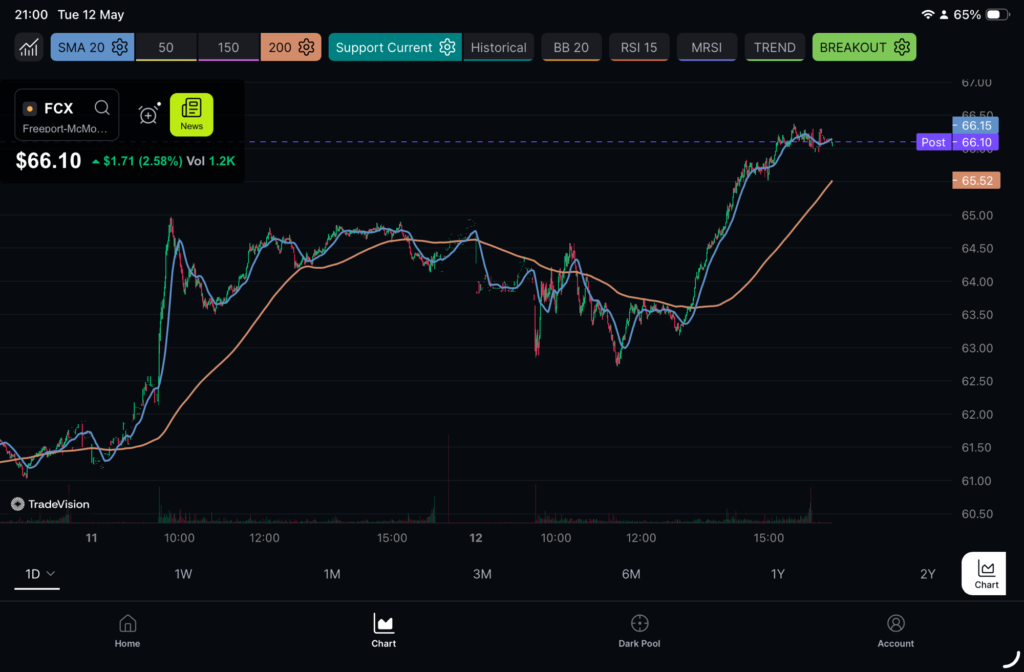
There’s a particular pain in realizing you’re completely right about a direction, yet walking away empty-handed. That’s how I felt. I was strongly convinced about three stocks: Freeport-McMoRan (FCX), Alcoa (AA), and Cameco (CCJ). My intuition, sector research, and online sentiment all pointed toward a positive outcome. I invested $10,000 in each, expecting results within a month.
And I was right. But I didn’t get to see the gains.
The Trap
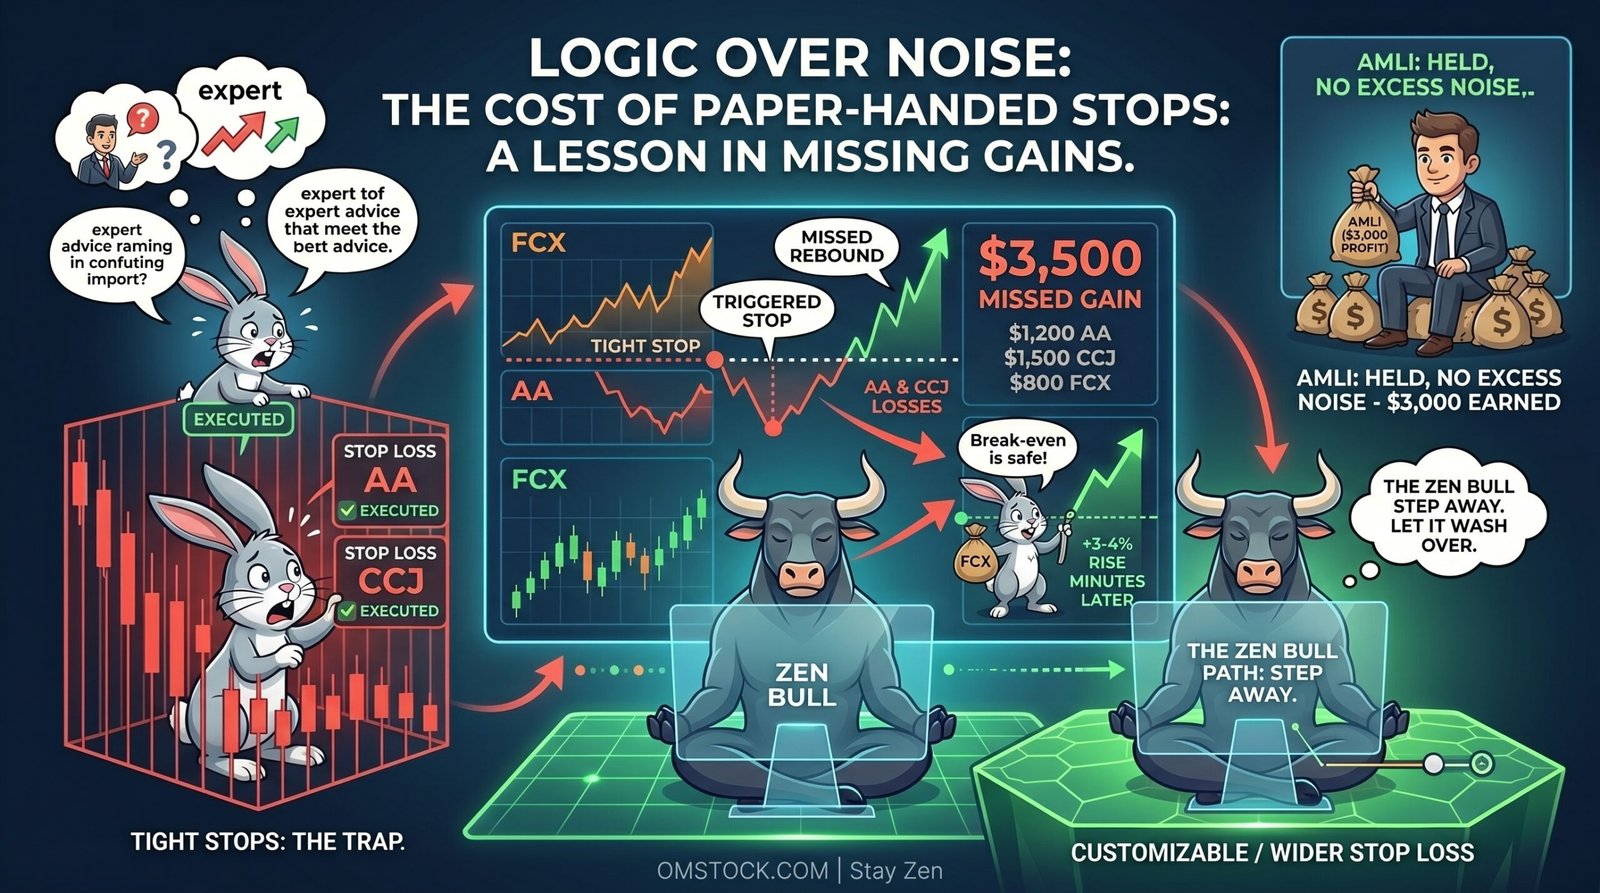
Despite my instincts, I followed some “expert” advice and set my stop-losses too tight. I thought they knew better than me. I let the Paper-Handed Rabbit take control, creating a cage so small the trades couldn’t breathe.
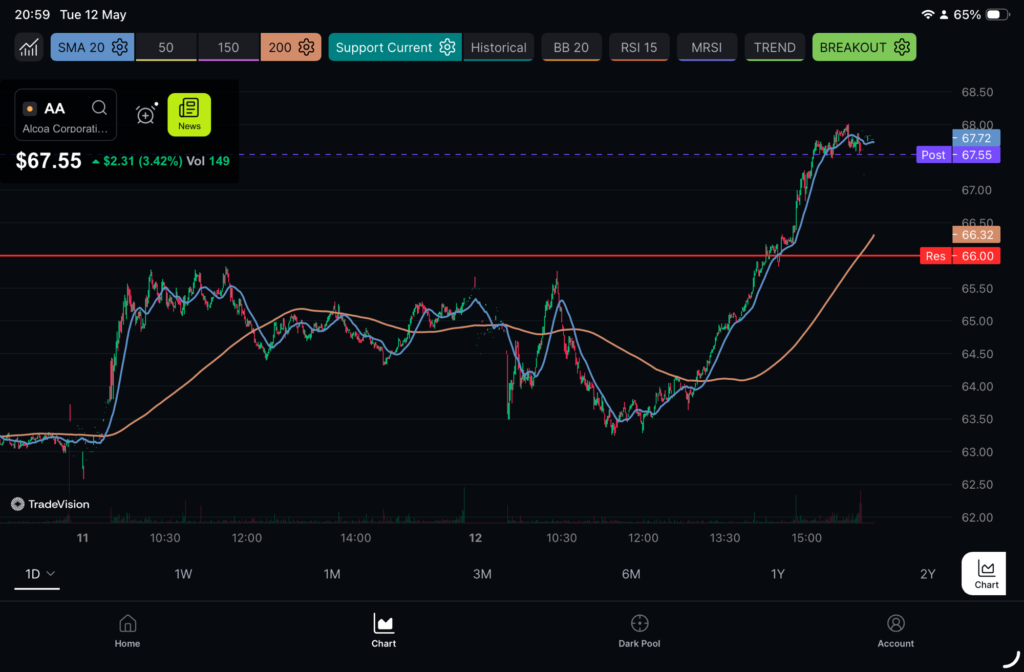
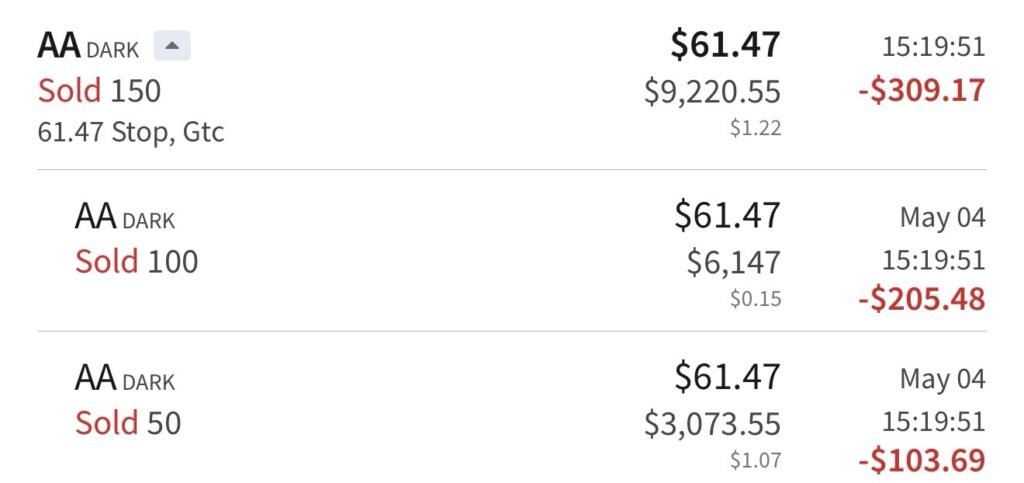
Alcoa (AA): Hit the tight stop early, exiting with a loss before the trend even began.
Cameco (CCJ): This one hurt the most — it dipped sharply, triggered my stop, then rebounded quickly. I watched from the sidelines as it soared without me.
Freeport (FCX): The only winner, showing a profit. But frustration with the others led me to sell just to break even.
Minutes later, Freeport rose 3–4%.
The Math of Frustration
Had I not let those “experts” convince me to keep stops narrow, I’d be up $3,500 now. Instead, I’m even. Initially, that $3,500 would have been a huge boost, especially during slow work periods.
It’s ironic. I started trading Amaroq Minerals (AMLI)—a junior gold miner in Greenland—without knowing much, through a local bank. I simply held on, invested $10,000, and earned $3,000 in a month. Back then, I didn’t “know too much.” Now, I thought I did, and the FOMO Monkey and external advice clouded my judgment.
The Path Forward
It’s disappointing and heavy. But instead of revenge trading or battling the market, I’m choosing the only path a Zen Bull takes: stepping away for a day or two. I’ll sit with my emotions, let them wash over me, stay with them, and release them when I’m ready. The market will still be here. Right now, I need to regain my conviction and quiet the outside noise.
The market is showing some serious strength today, and while I almost pulled the trigger on a sale, I’ve decided to stay the course. Here’s exactly what’s happening in my portfolio right now and why I’m letting it ride.
Freeport-McMoRan (FCX): The Morning Dilemma
I’ll be honest—I was looking to sell Freeport today to break even. My gut was telling me we might see a dip tomorrow morning, and taking the slight win is usually a smart move. But the broader market is just too positive to ignore. With the Nasdaq and S&P hitting all-time highs today, the momentum is clearly behind the materials sector. I’m sticking with it to see if we can push even higher.
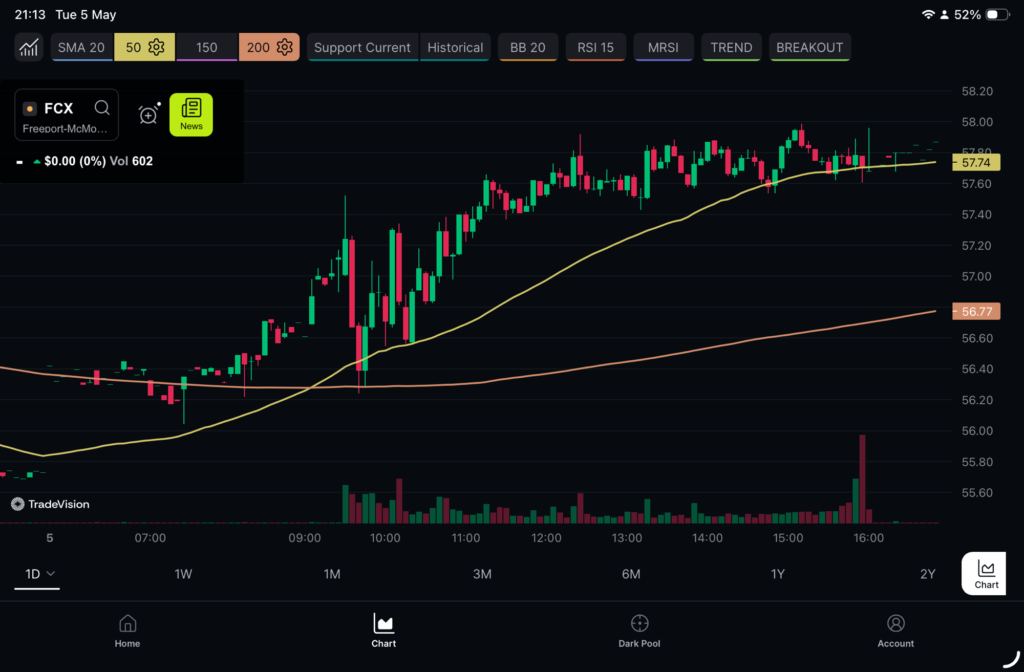
Today was a lesson in the difference between a stock’s performance and a trader’s profit. FCX was a rocket ship, up over 4%, but because I entered my position at $57.64 last week, I only saw a total gain of 0.27%. This is the reality of trading: sometimes you have to sit through the ‘recovery’ before you get to the ‘profit.’ I’m not discouraged—the fact that I’m in the green at all after today’s volatility shows that the support levels are holding.
FCX chart after the market close.
Cameco (CCJ): The Earnings Shakeout
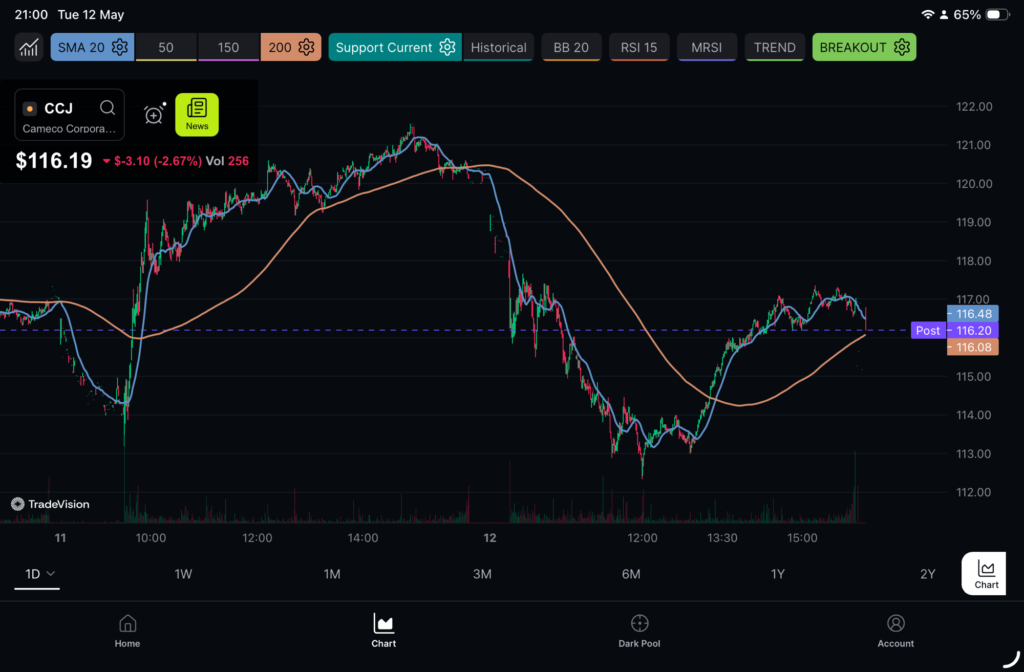
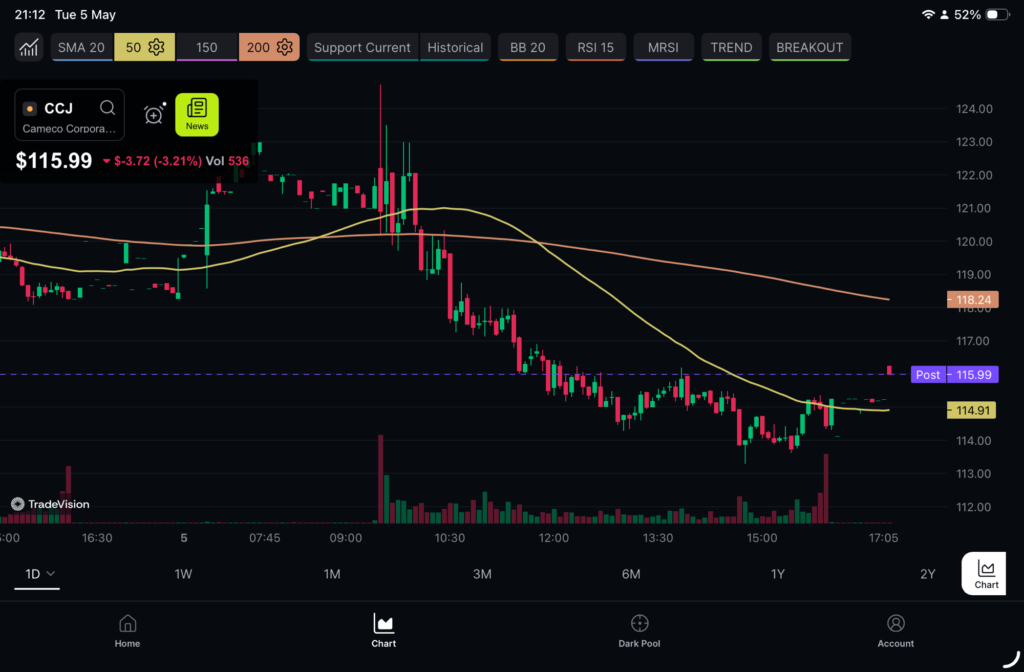
This one was a rollercoaster. Cameco dropped its Q1 earnings this morning and it was a massive beat—nearly 30% above expectations. We saw an immediate pre-market jump to 121, but then the “sell the news” crowd stepped in and dragged it back down to the 114 range.
A lot of traders might see that red candle and jump ship, but I’m holding my ground. My belief is that this isn’t a “crash”—it’s a shakeout. The fundamental story for uranium hasn’t changed. With countries in Europe (like Hungary and their Paks II project) pushing ahead with nuclear power regardless of EU pressure, the demand for non-Russian uranium is only going to tighten.
CCJ chart after the market close.
The Prediction for Tomorrow
I’m betting that the “real money” institutions will look at today’s dip as a buying opportunity. My prediction? We see some early morning weakness followed by a steady climb in the later part of the day tomorrow as the market realizes the earnings beat was the real deal.
The Strategy
I’m not just trading on hope—I’ve got my stop-losses firmly in place. If the market proves me wrong and crosses my line, I’m out. But as long as the indices are breaking records and the uranium supply-demand story stays this tight, I’m staying invested.
Sometimes, the market has a way of checking your ego, and yesterday, it handed me a classic lesson. I was stopped out of my Alcoa (AA) position, and in hindsight, it was a mistake on my part. Not because the trade idea was poor, but because I overlooked the “math of the swing.”
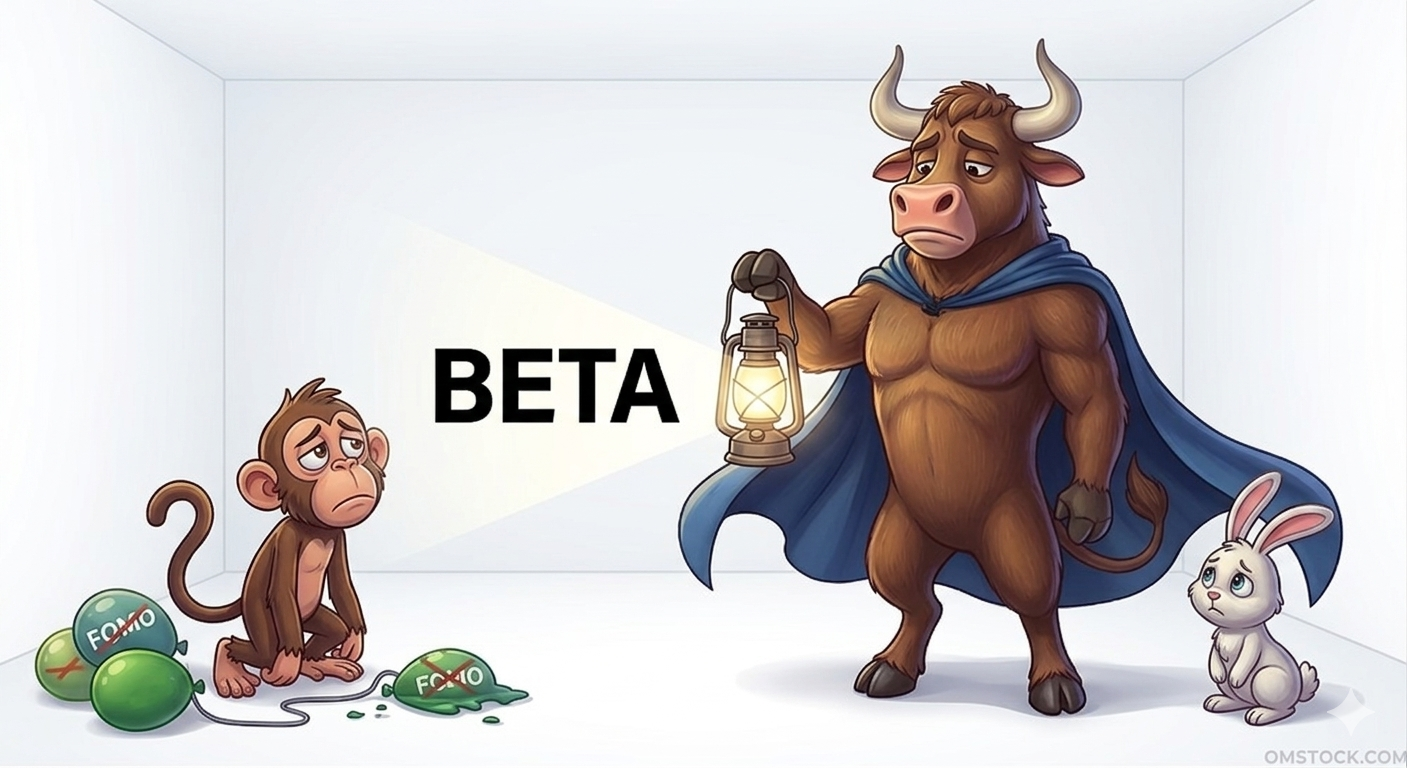
I was betting on a one- month recovery but set my stop loss as if I were trading a slow- moving utility stock. I forgot to consider the Beta.
What is Beta, and why did it affect my trade?
In my trading experience, I usually focus on the “Zen Bull” thesis—the overall picture. But the Beta number indicates the stock’ s volatility.
Market Average: A Beta of 1. 1.0 means the stock moves in sync with the market.
Alcoa’ s Beta: AA has a Beta of 1. 7.
This indicates Alcoa is 70% more volatile than the average stock. If the market sneezes, Alcoa catches a cold; if the market drops 1%, Alcoa could drop 1. 7%. By setting a tight stop loss on a high- Beta stock, I set myself up for a trap. The “noise” of a typical Tuesday morning was enough to trigger my exit, even though my one- month outlook was unchanged.
The Mistake: I didn’ t give the stock enough “room to breathe.” High Beta calls for a wider safety margin.
How to find Beta (Don’ t skip this step!)
If you’ re using Omstock. com, avoid the same mistake. Here’ s how to find Beta before investing:
Your Broker App: Many professional platforms like Interactive Brokers display Beta in the “Key Statistics” or “Instrument Details” section for any stock.
Financial Sites: Visit Yahoo Finance or Google Finance, input the ticker (e. g., AA or CCJ), and find Beta listed under ” Beta (5 Y Monthly) ” on the main summary page.
The “Vibe” Check: A Beta above 1. 1.5signals a “jumper”- expect larger swings.
Moving Forward
I won’ t let the FOMO Monkey influence me after this stop- out. I see this as a lesson for my Omstock journey. Next time, I’ ll check the Beta first and adjust my position size so I can handle a wider stop without risking too much.
The Zen Bull remains calm, even when clipped. Onward to the next trade.
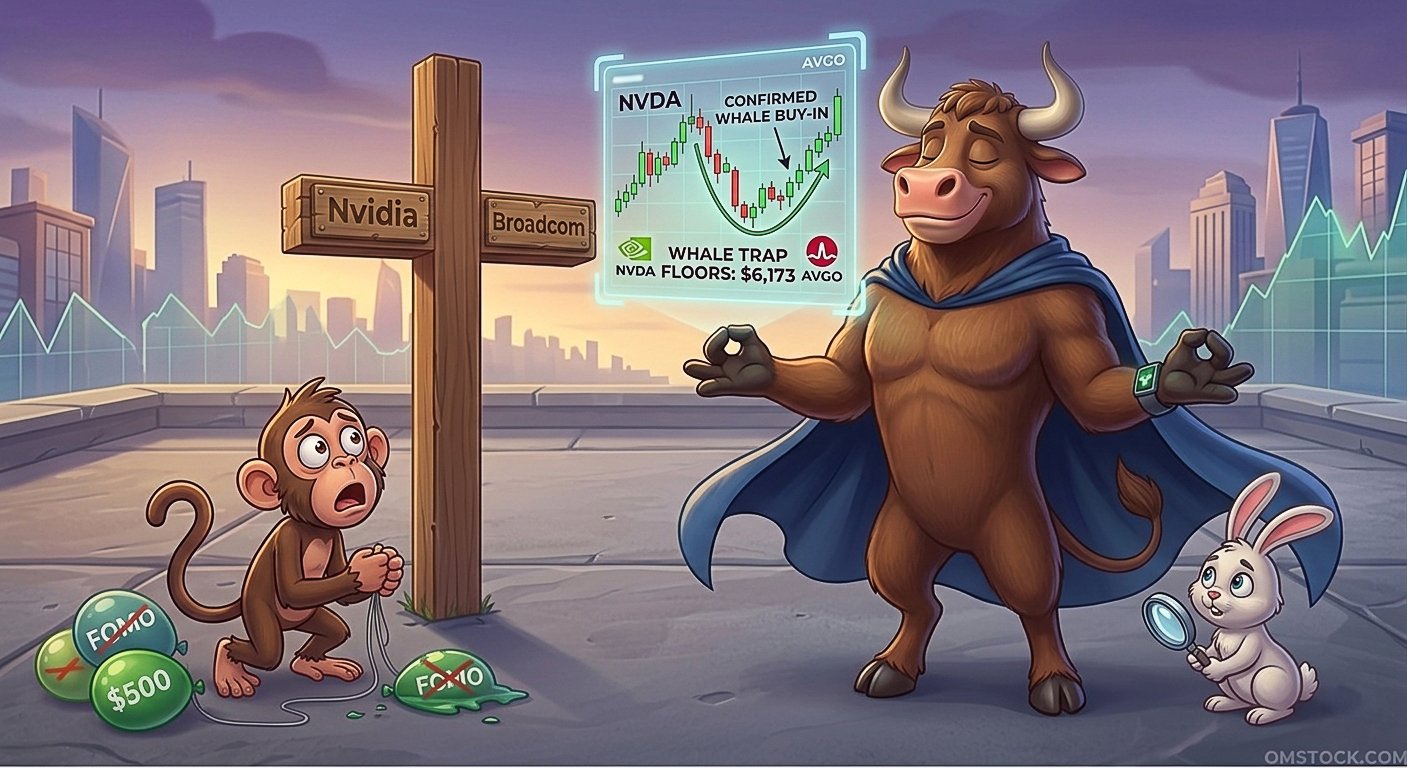
For those who aren’t deep in the “market weeds,” today looked scary. We saw a significant dip in Nvidia (NVDA) and Broadcom (AVGO) triggered by headlines questioning AI growth. To the average observer, it looked like the AI engine was stalling.
The “Whale” Logic
While the crowd was panicking about a single report, the Whales (Institutional Buyers) were looking at the bigger picture. They know that the “Big Four”—Google, Microsoft, Meta, and Amazon—are still locked in an arms race and will continue buying chips at a massive scale.
I decided to follow the Whales instead of the noise.
The System in Action:
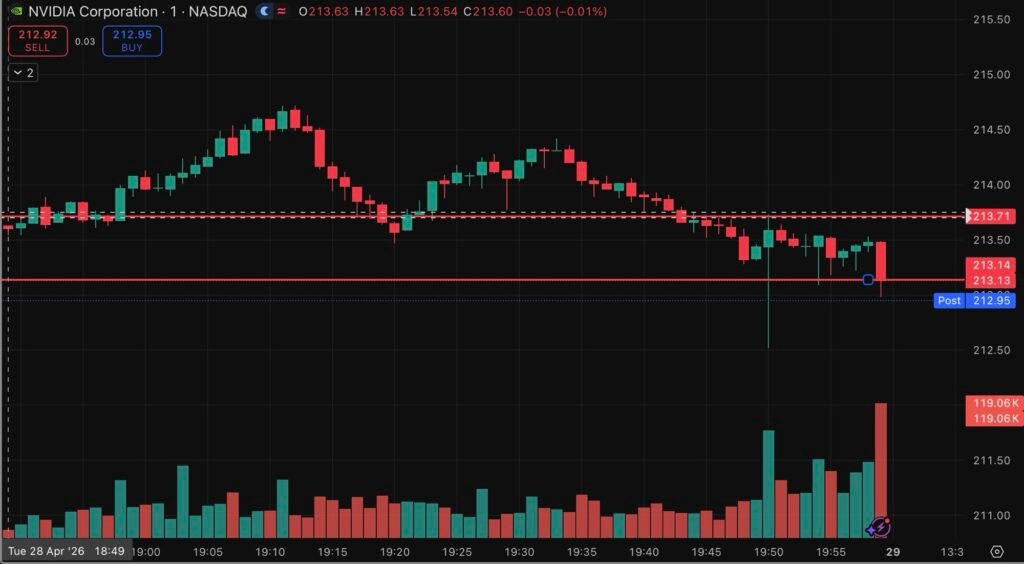
The Wait: I avoided the first 30 minutes of chaos. By waiting for the “box” to form, I saw the true behavior of these stocks.
The Footprint: It became obvious that big buyers were stepping in. The price stayed steady ABOVE the morning lows ($208.20 for NVDA), proving the floor was solid.
The Trigger: Once the price broke back ABOVE the morning high ($212.63), the reversal was confirmed. The Whales were officially in.
NVIDIA on Tradingview.com
The Trade Execution:
I reclaimed my position at $213, paying in two increments to reach a total of 40 SHARES.
The Nerve Test: I’ll be honest—seeing that final “red candle” dip just before the 8:00 PM close (Iceland time) touched a nerve. But I didn’t flinch. NVDA officially closed the session at $213.07, still holding above our breakout line.
Looking Ahead:
With Meta and Microsoft reporting earnings tomorrow (April 29), the market is coiled like a spring. The Whales didn’t sell today; they reloaded. My system is set, my stop-loss is at 208.10, and I’m targeting 222.
The lesson for today: Watch the behavior, not the headlines. If the Whales are still in, so am I.
Why Broadcom (AVGO) is my “Warning Signal”
While everyone stares at Nvidia, I keep one eye on Broadcom. In our Omstock.com system, Broadcom is the “Canary in the Coal Mine” for the entire AI sector.
Here is the logic:
Nvidia provides the “Brains” (the GPUs).
Broadcom provides the “Nervous System” (the networking and custom silicon) that connects those brains.
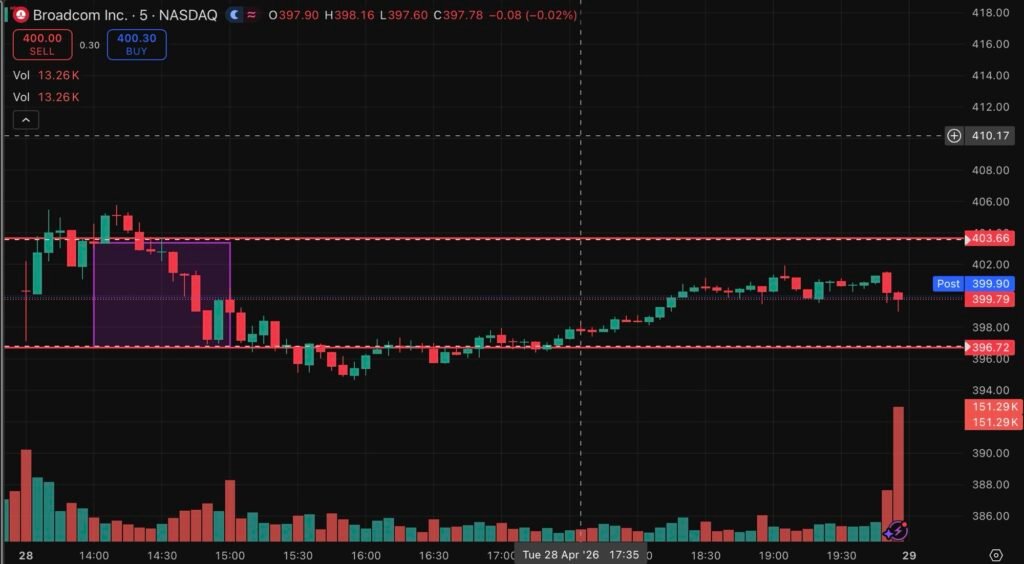
If the Big Four (Meta, Google, etc.) were actually slowing down their AI spending, Broadcom would feel it first. Why? Because Broadcom’s chips are built into the very foundation of the data centers. Today’s “Big Red Candle” in AVGO (dropping to ~$399) was a nerve-wracking sight, but it also created the “Springboard Effect.”
Broadcom on Tradingview.com
The $650 Billion Bet
Tomorrow is the “Big Test.” These four giants have signaled a staggering $650 Billion capital expenditure budget for 2026.
The Bull Case: If their earnings reports confirm they are spending that money as planned, the “OpenAI panic” from today will vanish instantly.
The Impact: My 40 shares of NVDA are positioned to catch that wave. If the “Whales” confirm the $650B is real, we aren’t just looking at $222—we’re looking at a sector-wide breakout.
Update
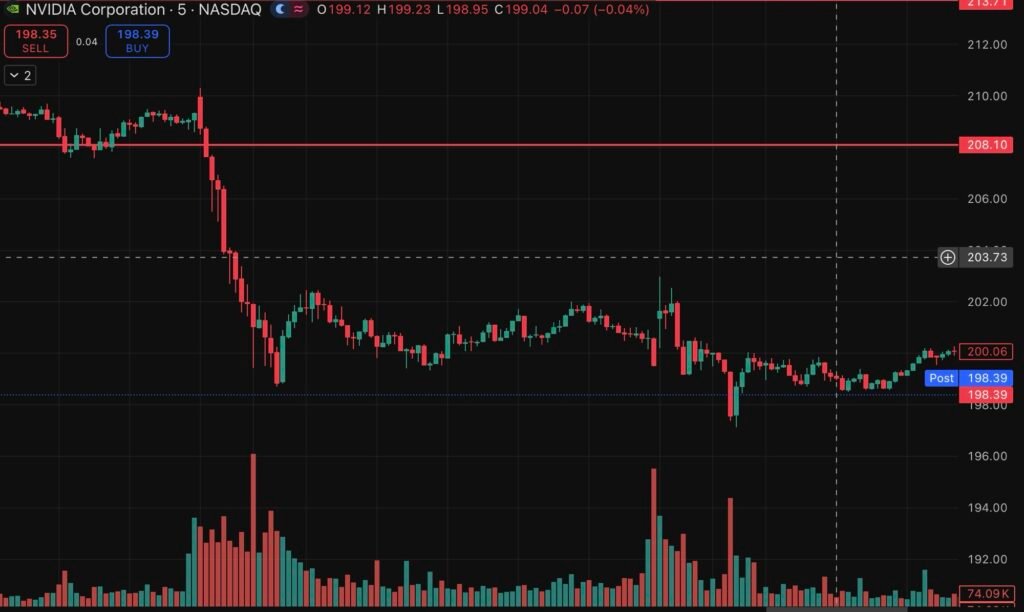
So the playbook didn’t work out. Nvidia fell down and my stop loss triggered. it’s definitely tricky paper loss rapid within.
What Triggered the Sell-Off?
The decline wasn’t sparked by a single failure, but rather a “perfect storm” of market factors:
• Valuation Fatigue: After months of vertical climbing, the “Zen Bull” was met with a wave of profit-taking. When a stock is priced for perfection, any minor macro shift can trigger a cascade of sell orders.
• The “Hedge Fund Whale” Rebalance: Institutional players began rotated capital out of overextended tech names into defensive sectors, seeking to lock in gains ahead of upcoming economic data releases.
• Inventory Concerns: Whispers regarding the sustainability of the current Blackwell chip ramp-up caused a momentary lapse in confidence, providing ammunition for the “Permabear Owl” to argue that the peak is behind us.
The Psychological Battle
As the candles turned red, the market saw the classic tug-of-war between different trading personas. The FOMO Monkey likely felt the sting of a late entry, while the Paper-Handed Rabbit scurried for the exits at the first sign of a 4% drop.
For those following the journey here at Omstock.com, yesterday serves as a masterclass in risk management. Volatility isn’t a sign of a broken company; it’s a sign of a liquid, breathing market.
Looking Ahead
Is this the start of a trend or just a healthy “reset” of the technical indicators?
• Support Levels: Analysts are eyeing the previous breakout zones to see if buyers step back in.
• Earnings Anticipation: All eyes remain on the next quarterly report to see if the fundamental growth can continue to outpace the skeptics.
Trading is as much about mindset as it is about charts. Stay centered, watch the volume, and remember that even a bull needs to rest before the next charge.
Watching the market open today was a lesson in institutional psychology. We saw a massive drop in the pre-market, followed by a straight-up climb at the opening bell. To the untrained eye, it looked like a recovery. To a disciplined trader, it looked like a trap.
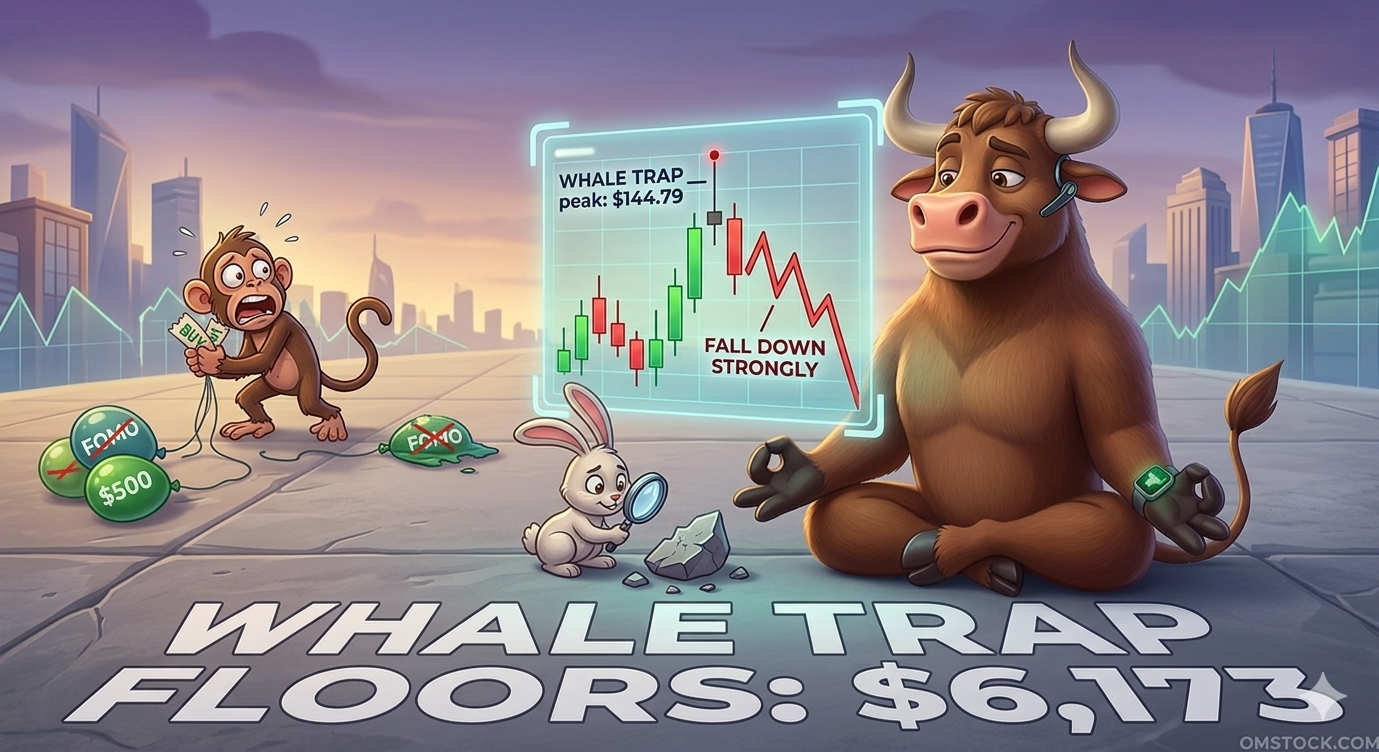
The Hedge Fund Whales executed a classic maneuver: they sold heavily before the bell, allowed the “headline news” of the S&P 500 hitting 7,000 to lure in retail buyers, and then used that buying pressure as exit liquidity. By the time the “FOMO Monkey” was clicking “buy” on the 7,000 breakout, the billionaires were already halfway out the door.
1. The “Thin” Milestone
The headlines today celebrated a historic moment as the S&P 500 hit an intraday high of 7,051.23. But price is a liar without breadth.
The Data: While the index hit a record, only 54.8% of S&P 500 stocks are actually trading above their 200-day moving average.
The Mirage: In a healthy, sustainable bull market, you want to see 70% or higher participation. Today’s rally was “thin air”—propped up by a few mega-cap giants while the average stock struggled to keep its head above water.
2. The “Skyrocket and Fall”
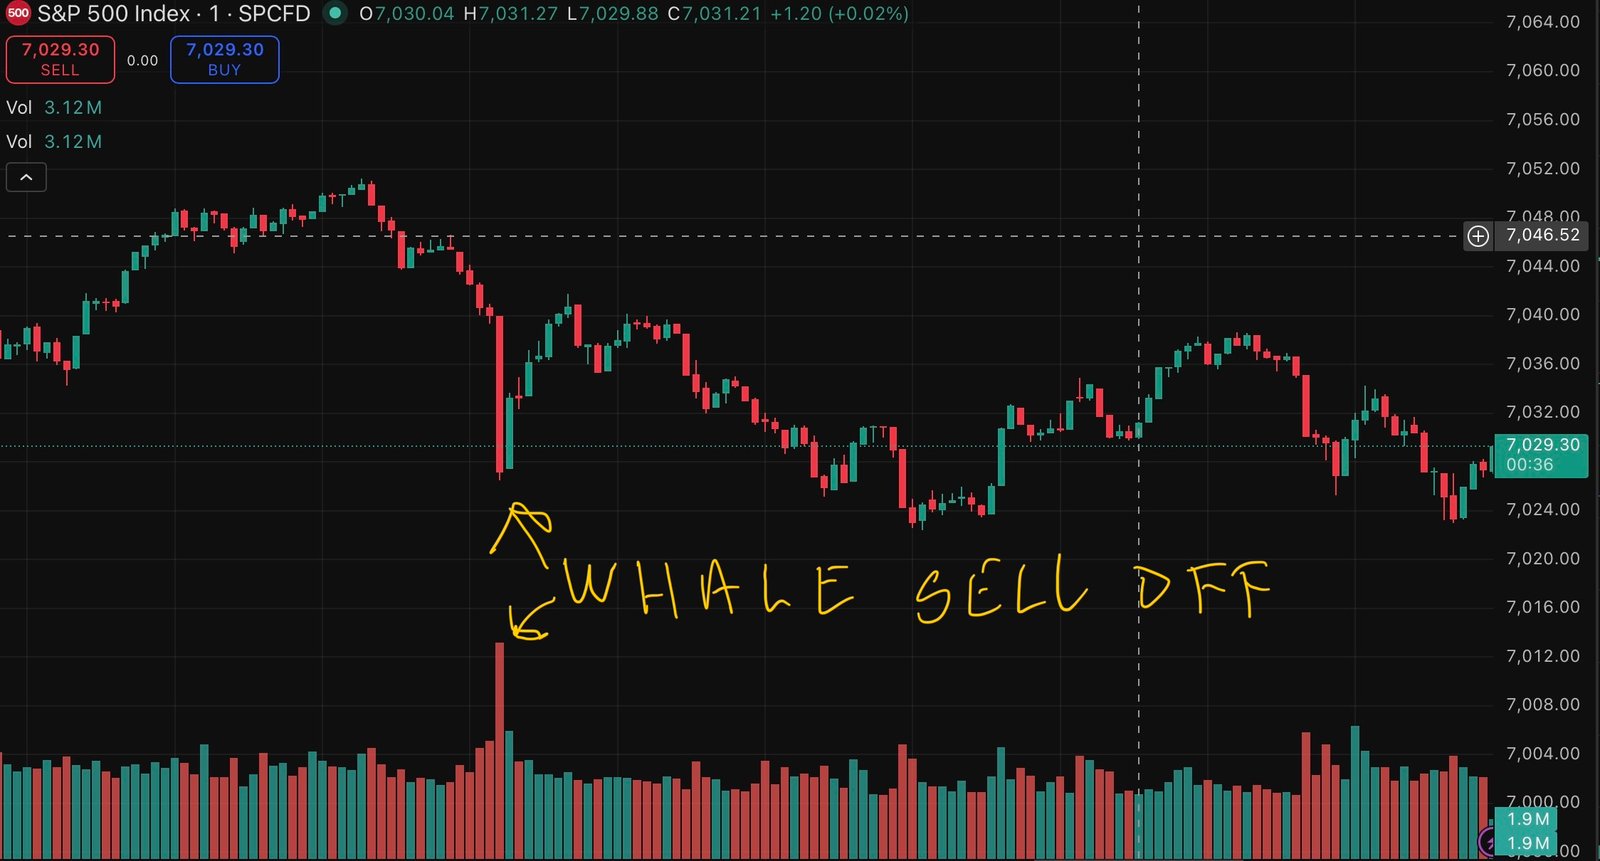
The market looked like a miracle at 9:30 AM and looked like a trap by 11:00 AM. The S&P 500 opened at 7,037 and immediately skyrocketed, but it lacked the institutional support to hold the high, eventually “falling strongly” to retest the 7,008 level.
This is Distribution. Big money is feeding shares to excited retail traders who are just now reading the headlines.
Case Study: Palantir (PLTR)
Palantir provided the perfect roadmap of today’s trap.
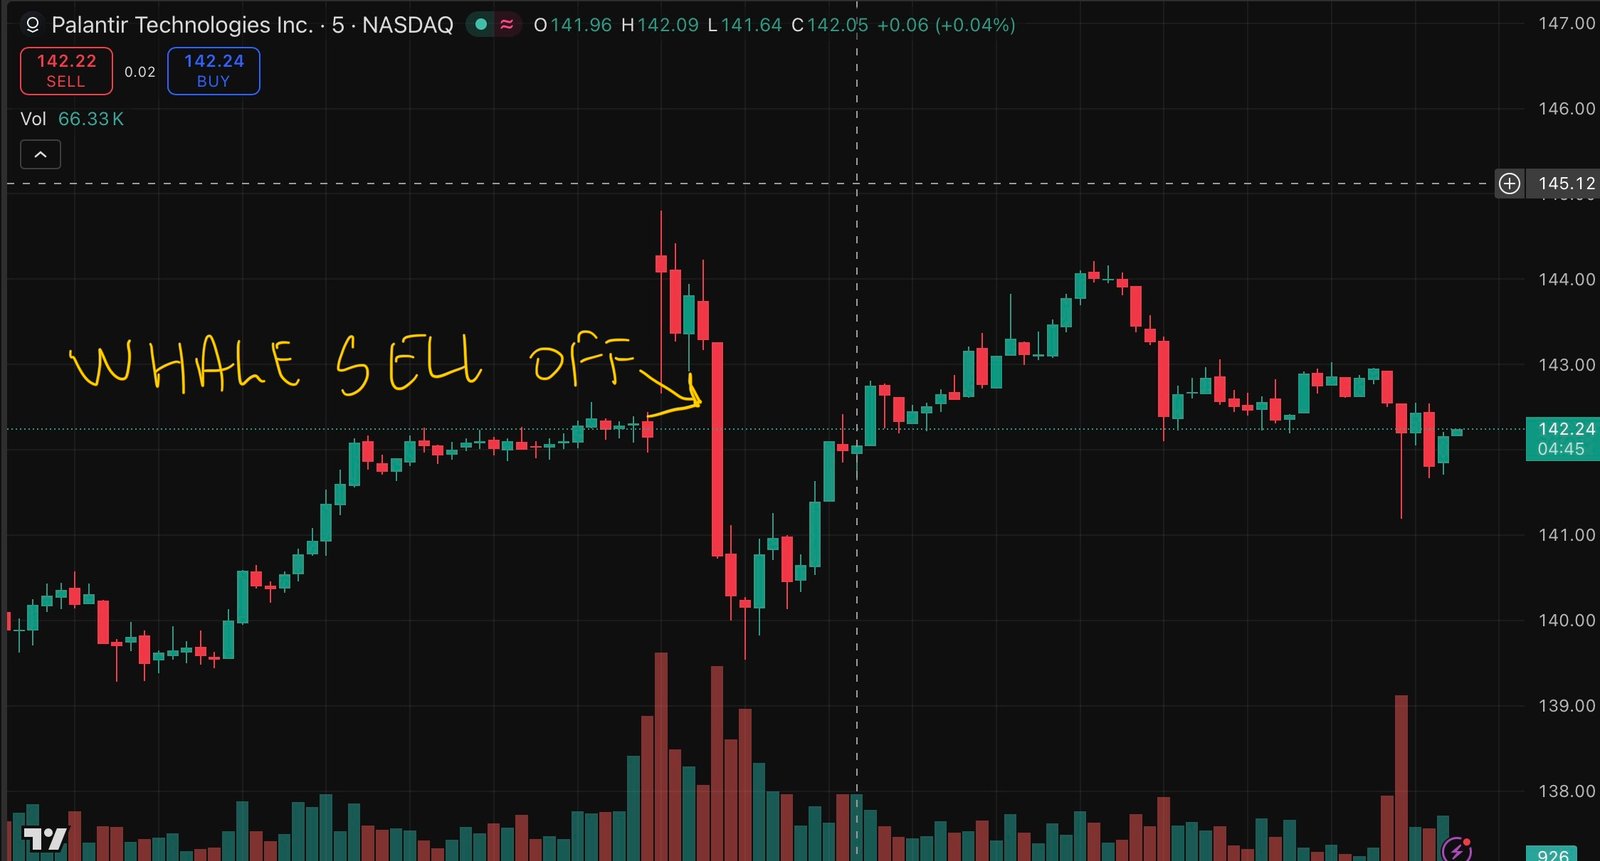
The Lure: It opened at $144.29, sparking a retail rush.
The Rejection: Within hours, it fell to $139.53.
If you bought the “dip” at $142 because it looked “cheaper” than it was 10 minutes prior, you weren’t trading—you were being trapped. You provided the exit liquidity the Whale needed to dump their position.
3. The Safety Net: The Crisis Floor
The Whale starts selling long before the bell rings. By the time you see the “Skyrocket,” the trap is already set. If you are buying a 3% drop from an all-time high without checking the volume, you aren’t buying a discount—you are providing an exit for a billionaire.
The Map Forward:
The Trend: The 200-day moving average for the S&P 500 is currently at 6,670.
The Confirmation: If this 7,000 breakout fails and we close back below the old January high of 6,978, the trap has snapped shut.
In that scenario, we won’t be looking for a “dip” to buy; we will be looking for a fast drop back to our 6,173 Crisis Floor.
I’m documenting every step of this trading journey here at Omstock.com. If you’re tired of chasing the FOMO Monkey and want to trade with Zen discipline, subscribe to follow my path toward the Crisis Floor and beyond.
The market must breathe before it can run. Don’t let a micro-movement steal your macro-conviction.
I was looking at two charts yesterday that I’d traded the day before. I’d walked away with a modest profit from day trading, but seeing them rise again—mimicking the previous day’s gains—hit me with a flicker of regret. I’d missed the second wave. It’s clear these assets are in a “wavy” cycle right now.
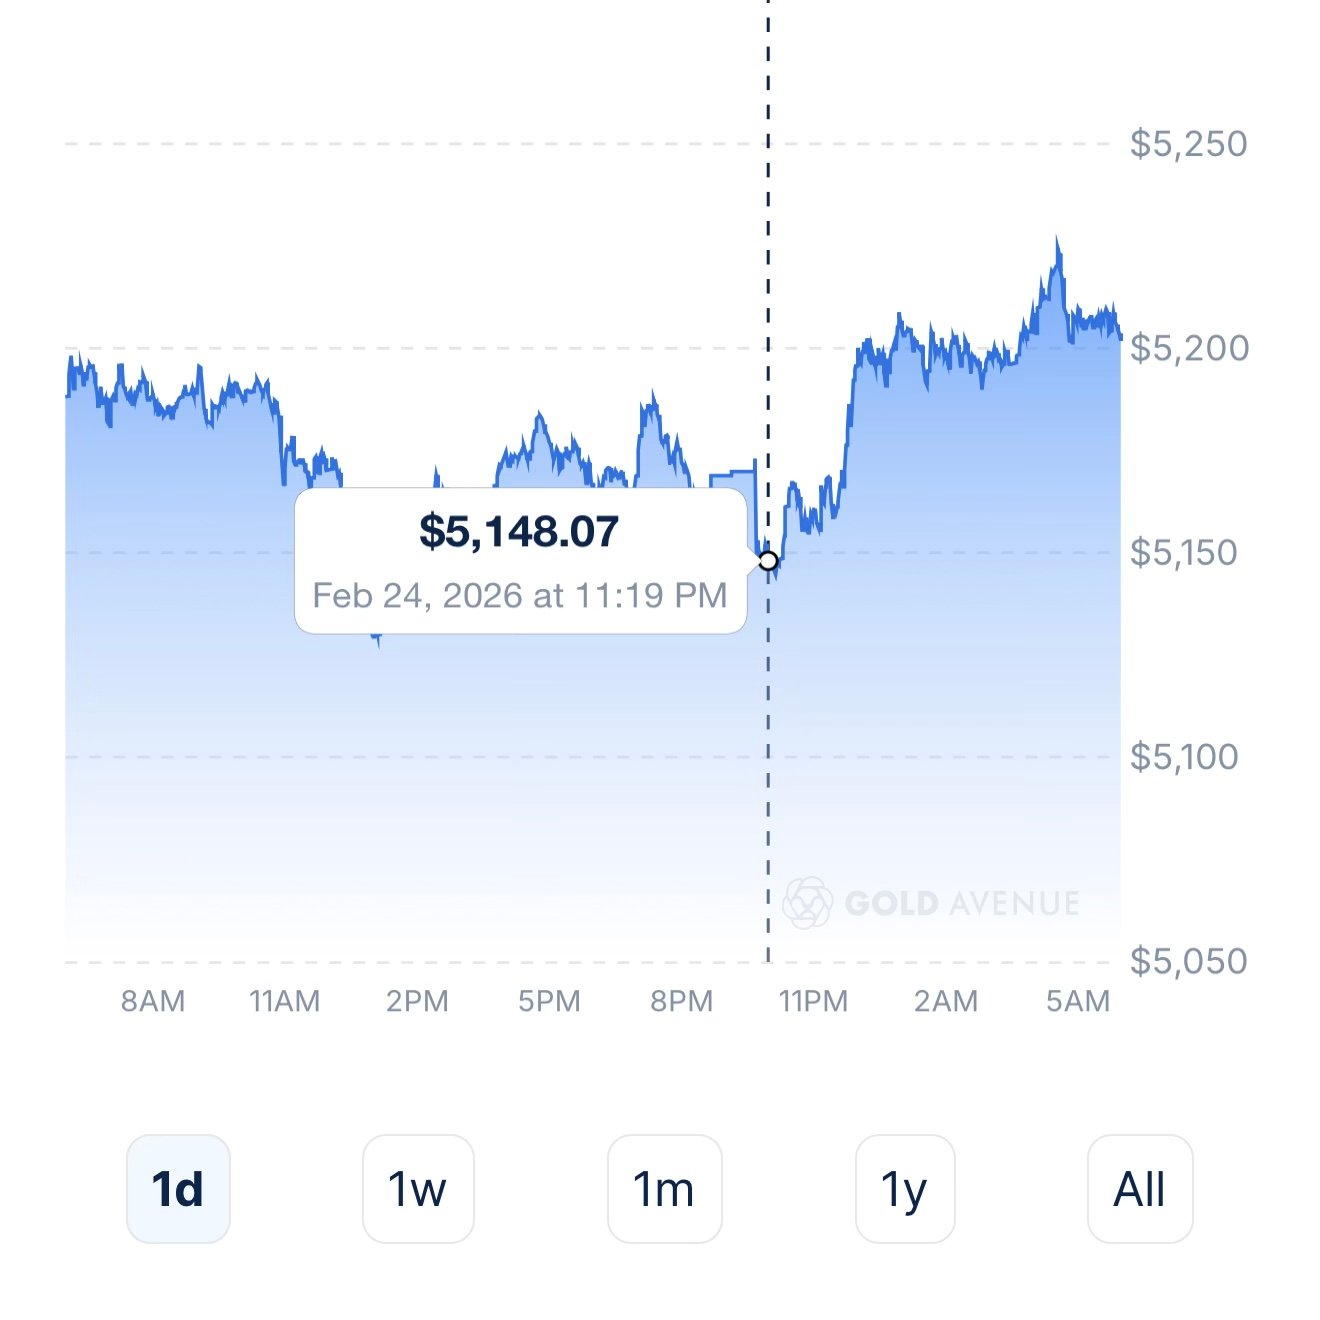
Then, I turned my attention to gold. My mentor’s thesis is clear: gold is headed up, and when it moves, it will pull the mining companies with it. But in the moment, gold dipped. Even though I believe in the long-term play and the global tensions supporting it, that small downward swing sparked a moment of unease. I found myself questioning: Is it going lower? Did I miss something?
Gold eventually recovered and moved back up, but the experience was a reminder of how easily micro-movements can affect your psychology. This is where awareness becomes the ultimate tool. Even when you have skin in the game and a firm belief in the asset, those small swings can still reach you. The challenge isn’t just predicting the market; it’s defending your peace of mind against the noise.
The Zen Bull’s Lesson: How to Defend Your Peace
If you find yourself feeling that “uneasiness” during a minor dip, here is how to stay grounded:
Zoom Out: Micro-movements are just the market breathing. If your long-term thesis (the global tension) hasn’t changed, the price wiggle shouldn’t change your mood.
Identify the Characters: Is the FOMO Monkey telling you that you’re losing out? Is the Paper-Handed Rabbit trying to make you jump too early? Recognizing these internal voices takes away their power.
The Cost of Admission: Volatility is the price we pay for the eventual “shoot up.” You cannot have the peak without sitting through the valley.
Label the Feeling: Instead of saying “I am worried,” say “I am observing a feeling of worry.” This small shift in awareness keeps you from acting impulsively.