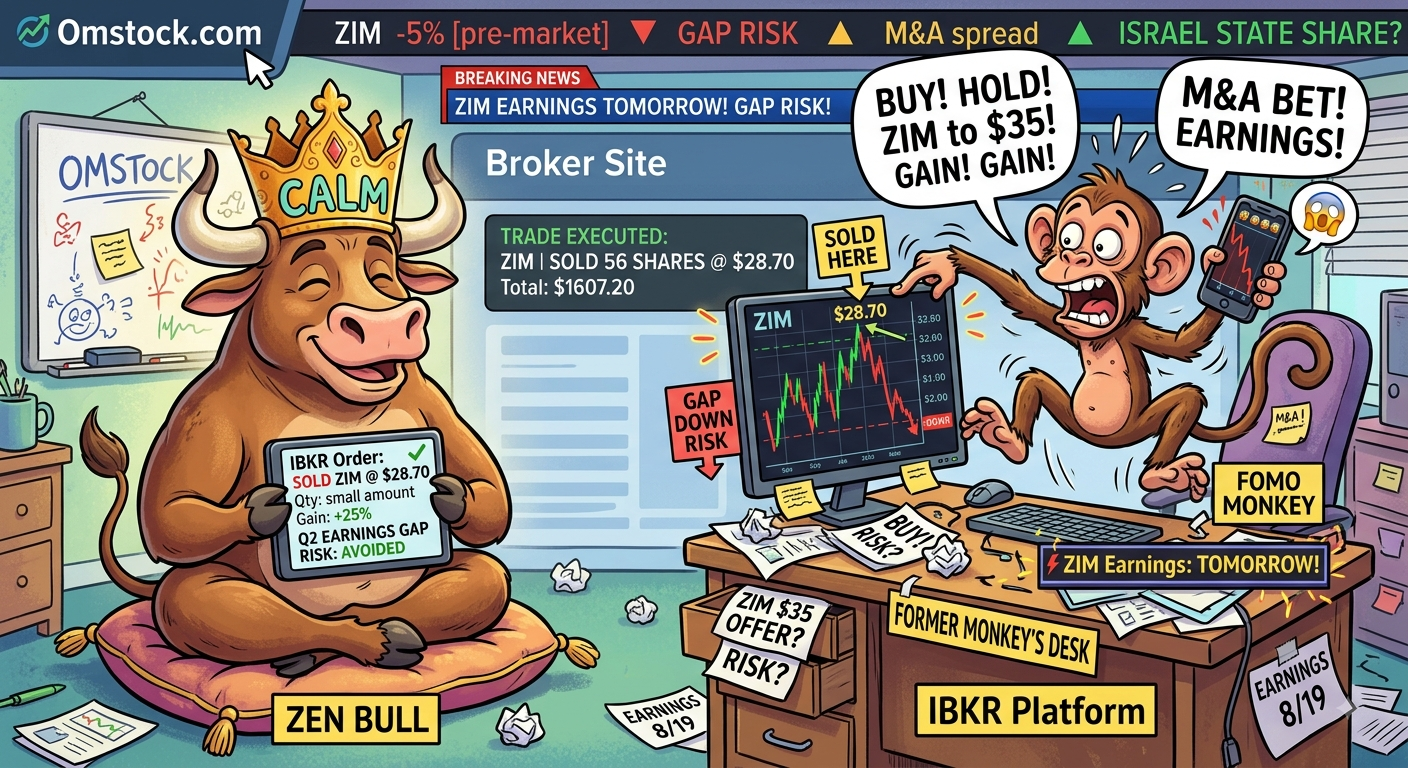
Closing With a Calm Mind
I closed my position in ZIM Integrated Shipping Services today with a calm mind and absolute conviction.
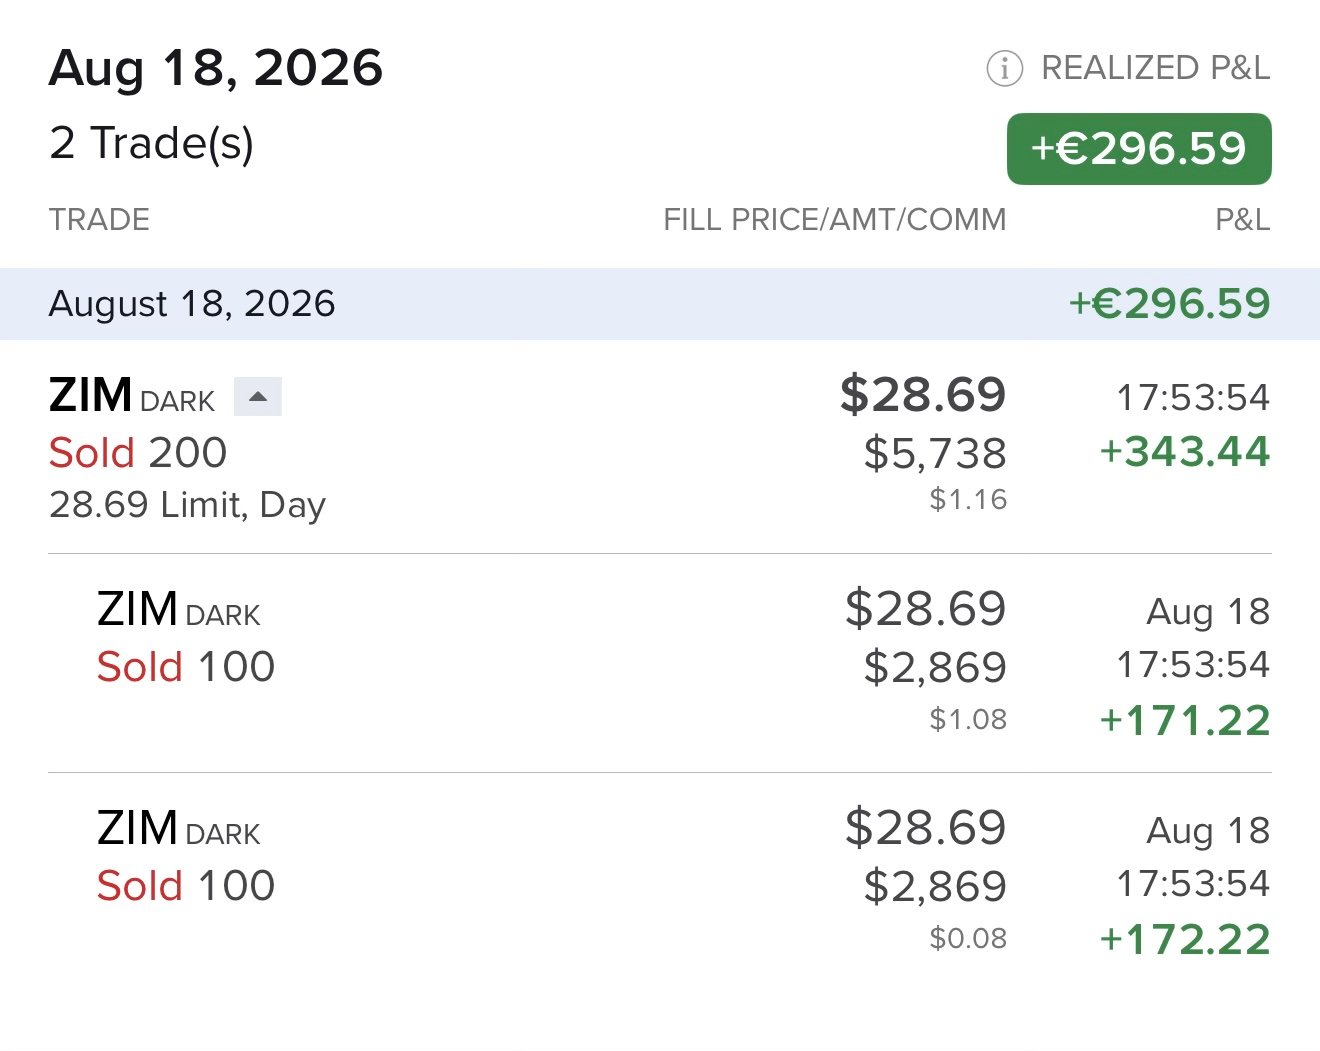
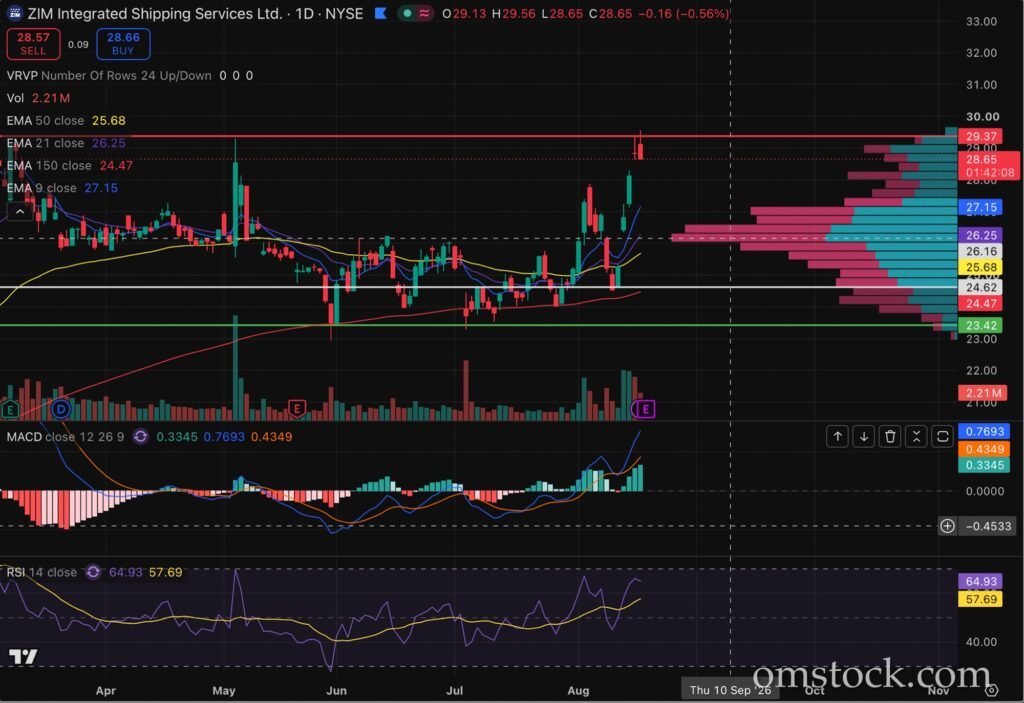
ZIM was trading near $28.70—hovering right around its 52-week high—with a pending $35-per-share all-cash takeover offer from Hapag-Lloyd on the table. On the surface, holding seems like easy math: if the transaction closes, there is still roughly 22% ($6.30 per share) of upside remaining.
That spread is not free money. The market leaves a discount on the table only when it prices in serious execution risk.
1. My Original Thesis Had Dissolved
I did not enter ZIM as a merger-arbitrage play. My original thesis was macro-driven: spot freight rates surging from geopolitical disruptions in the Middle East.
When the buyout offer arrived, the engine driving the stock completely changed. Continuing to hold was no longer a trend trade on global logistics—it was a brand-new, binary bet on regulatory politics. Specifically, whether the State of Israel will approve or veto the deal under its strategic Special State Share (“golden share”).
When the premise of a trade morphs into something you never signed up for, you don’t defend it on autopilot. You re-underwrite it from scratch.
2. Asymmetric Math: Capped Upside, Open Downside
At $28.70, my maximum reward was capped at $35. The downside, however, has no ceiling.
If the buyout collapses under political pushback, ZIM will instantly reprice as a standalone cyclical shipper. Standalone fundamentals offer little cushion right now: Q1 revenue fell to $1.40 billion (down from $2.01 billion YoY), posting an [latex]86 million net loss. Chasing a capped +[/latex]6.30 gain while exposing capital to a $10+ drop if the deal breaks is bad arithmetic.
3. Binary Earnings and Overnight Gap Risk
ZIM reports Q2 earnings tomorrow morning before the opening bell.
A stop-loss provides execution during market hours, but it is useless against a pre-market gap down. Holding through the report meant stacking quarterly earnings uncertainty right on top of sovereign regulatory risk.
Process Over Outcome
Exiting does not mean I am predicting a crash. The earnings could beat expectations, regulators could greenlight the merger tomorrow, and the stock could march straight to $35.
If it does, selling at $28.70 was still the right trade.
Discipline is measured by the risk profile at execution, not by the hindsight regret of leaving the last dollar on the table. The position was only about $1,600, but discipline is muscle memory—sloppy habits on small accounts become catastrophic losses on large ones.
I took profits into strength, protected my capital, and cleared mental bandwidth for the next setup.
This is a personal trading journal entry documenting my own process, not financial advice.