Tag: Technical Analysis

  • The Mystery of the “Jumping Stock Price” 📈🧙‍♂️

    The Mystery of the “Jumping Stock Price” 📈🧙‍♂️

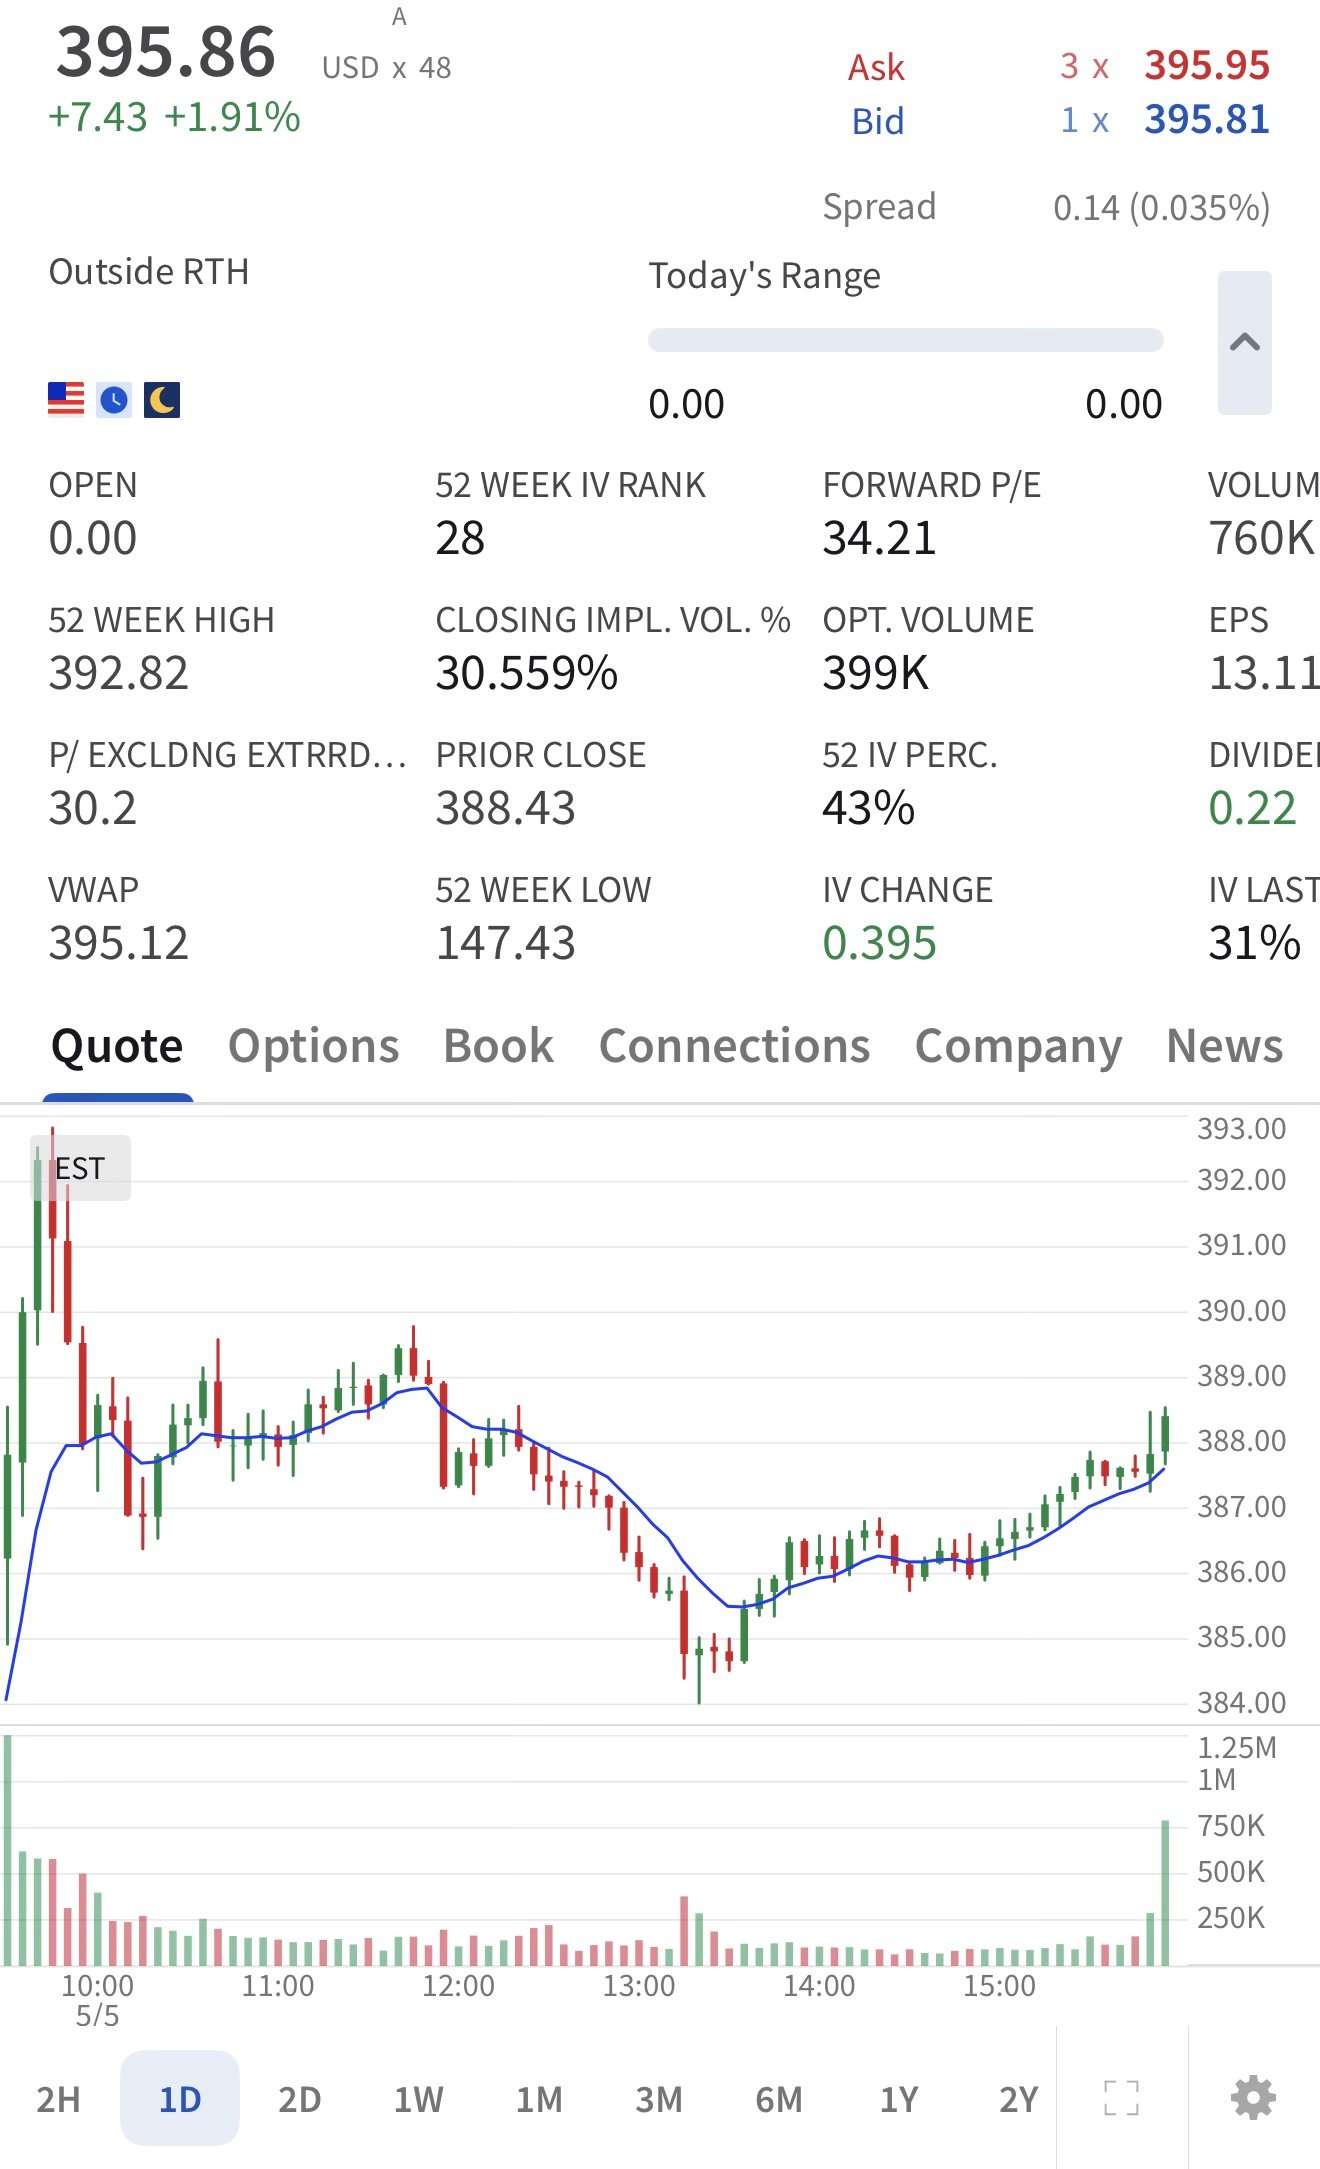
    Have you ever looked at a price tag at the store, but when you got to the register, the cashier told you it actually cost $10 more? That’s kind of what’s happening in this screenshot:
    A screenshot from Interactive Brokers shows you the gap in prices and the prices on the chart.
    A screenshot from Interactive Brokers shows you the gap in prices and the prices on the chart.

    Here is the breakdown of why the numbers look like they are playing a prank on us:

    1. The “Ghost Market” (After-Hours) 👻

    Most people think the stock market only works from 9:30 AM to 4:00 PM. But there’s actually a “secret” session called Extended Hours. In image.png, you can see a tiny label that says “Outside RTH”. This means the “Regular” market is closed, but a few people are still trading in the dark.

    2. The Big Jump (The “Gap”) 🚀

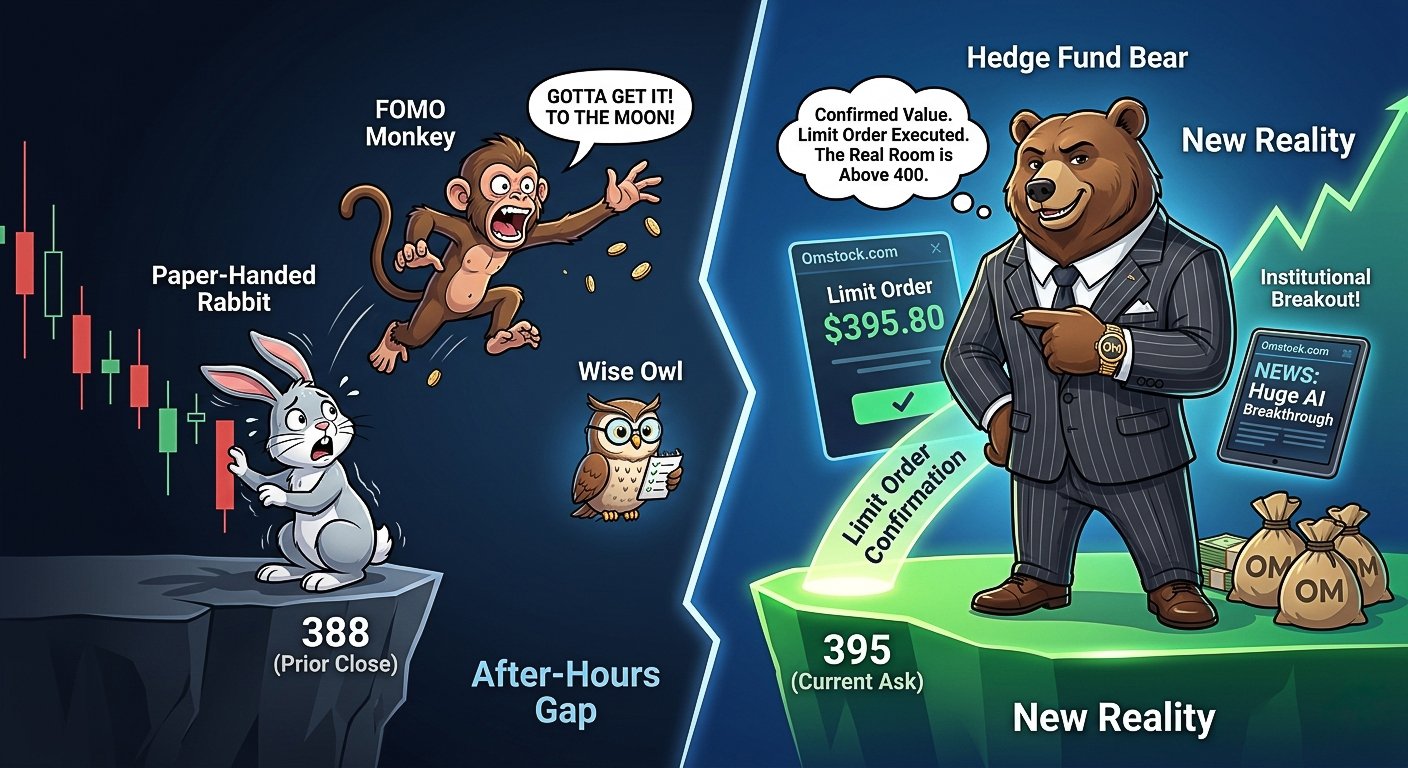
    On the chart, the price looks like it’s around 380 or 388. But the big number at the top says 395.86.

    • Imagine a video game character standing on a ledge at level 388.
    • Suddenly, while the game is “paused” overnight, the character teleports up to level 395.
    • The chart hasn’t drawn the new line yet because the official game hasn’t restarted! This is called a Gap Up.
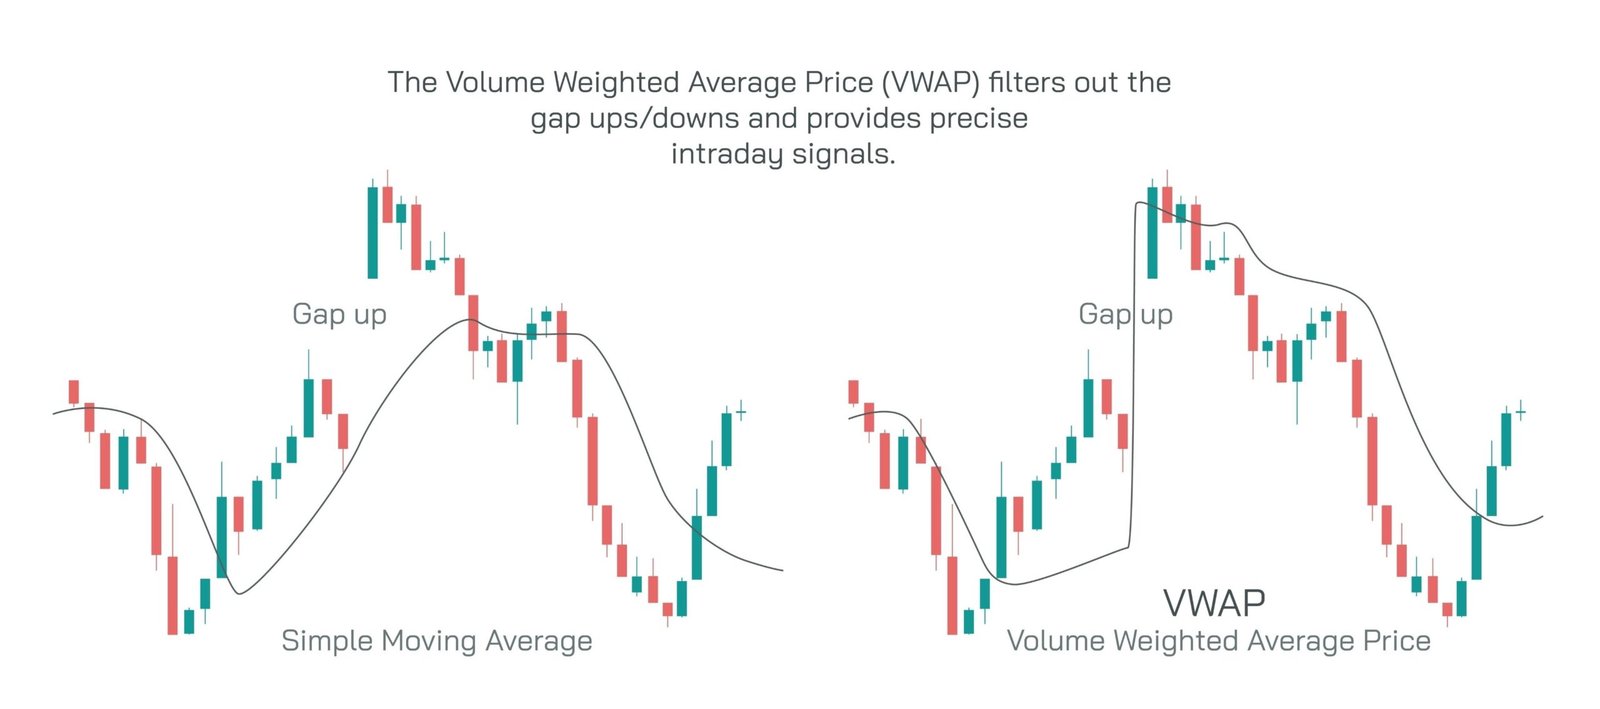
    This chart is lagging behind. It visually ends at the Prior Close of around 388. It is still displaying the

    3. Should You Buy Right Now? 🛒

    It might seem like a bad deal to buy at 395 when the chart says 380, but here’s the deal:

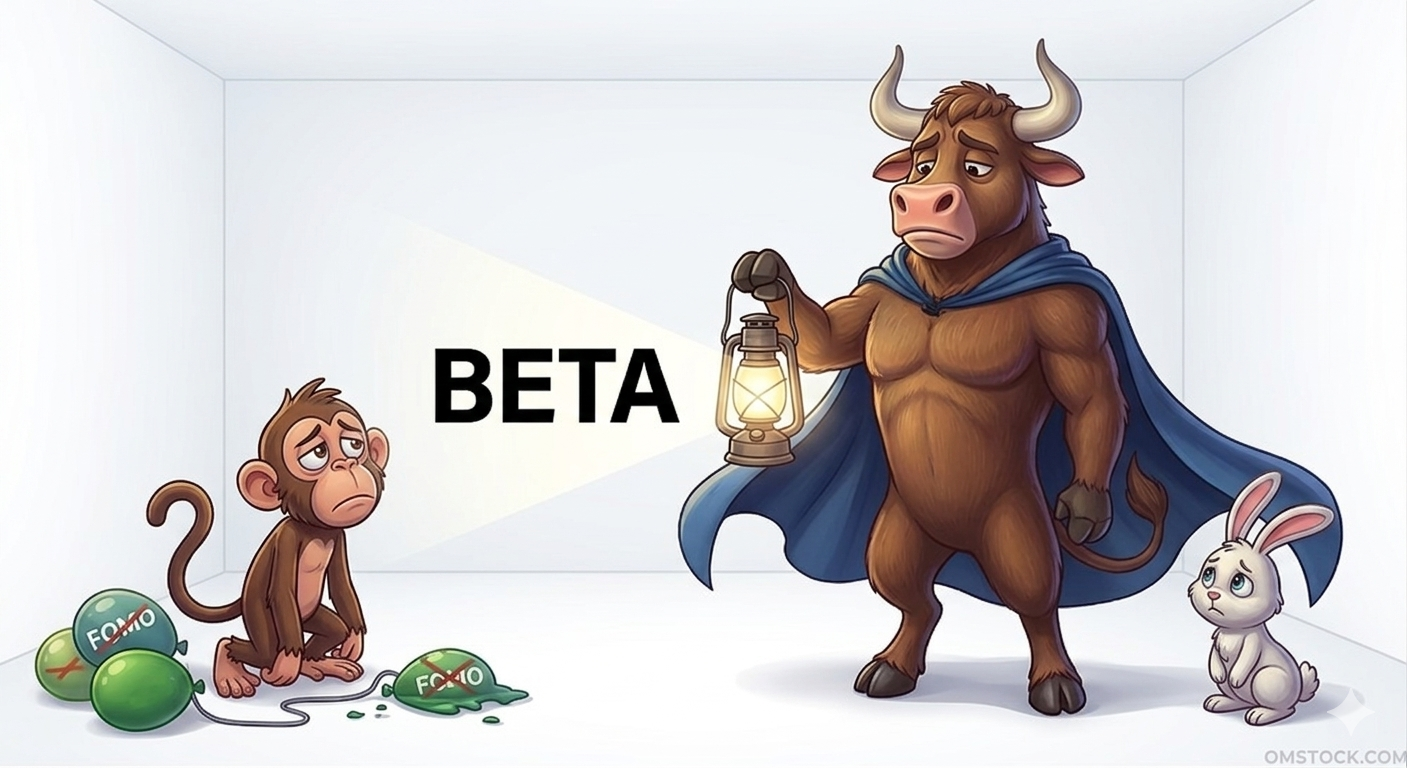
    • The FOMO Monkey 🐒: This character wants to jump in right now because they’re afraid the price will hit 400 or 500 by morning. They don’t care if they pay a little extra!
    • The Zen Bull 🐂: This character stays calm. They know that sometimes, when the market officially opens at 9:30 AM, all the excitement dies down and the price might drop back toward the old chart price.

    4. Can You Even Trade Now? 🛑

    You can, but you have to use a Limit Order. That’s basically telling the computer: “I will only buy this if the price is exactly X dollars.” If you just try to buy it normally, the computer might get confused because the “official” price is still being decided.

    The Lesson: Just because the chart shows one thing doesn’t mean that’s the price you’ll get! Always check the Ask (the seller’s price) and the Bid (the buyer’s price) before you hit that “Buy” button on Omstock.com.

    Why the “Pros” Might Buy at 395 🐳

    Even though the price jumped from 388 to 395, professional traders aren’t always just “chasing” the price. They might be buying because:

    • The “News” is Huge: Professionals might see a news report (like a big tech breakthrough) and realize that while 395 feels expensive compared to 380, the stock is actually worth 450. They want to get in before the rest of the world wakes up at 9:30 AM.
    • Arbitrage (The Price Matchers): Sometimes a stock is trading at different prices on different exchanges. Pros use super-fast computers to buy at the lower price and sell at the higher one instantly to pocket the difference.
    • Hedge Fund Math: A big “Whale” might need to buy millions of shares. They know that if they wait until the official opening bell, there will be so much “noise” and competition that they might end up paying even more than 395.
    • The “Breakout” Signal: On a chart, 395 might be a “Resistance” level. To a pro, if the price breaks above that level in after-hours, it’s a signal that the stock is now “unstoppable” and ready to fly.

    The Pro Secret: They aren’t guessing. They use advanced tools to see how many people are waiting to buy and sell behind the scenes. While the Paper-Handed Rabbit is scared of the jump, the pro sees it as a door opening to a much bigger room!
  • The “Zen Bull” Gets Clipped: A Lesson in Beta and “Noise”

    The “Zen Bull” Gets Clipped: A Lesson in Beta and “Noise”

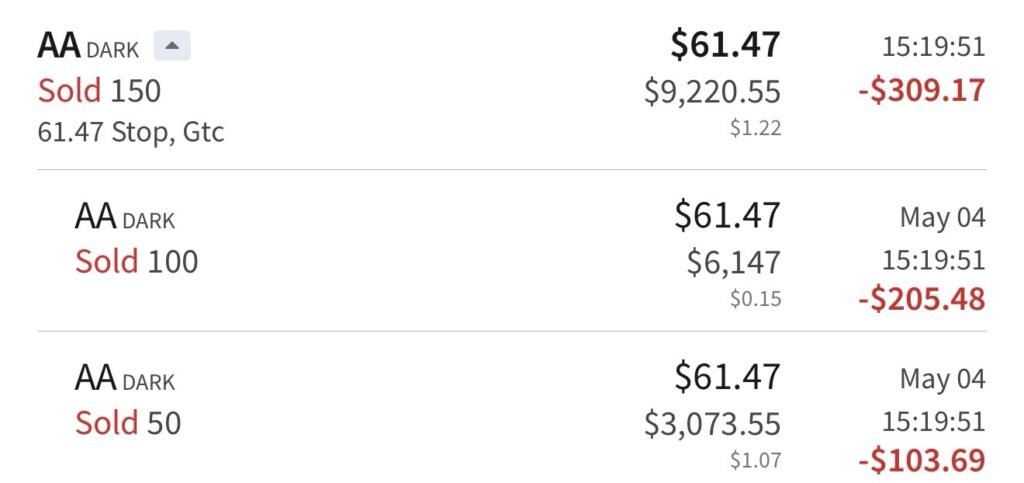
    Sometimes, the market has a way of checking your ego, and yesterday, it handed me a classic lesson. I was stopped out of my Alcoa (AA) position, and in hindsight, it was a mistake on my part. Not because the trade idea was poor, but because I overlooked the “math of the swing.”

    I was betting on a one- month recovery but set my stop loss as if I were trading a slow- moving utility stock. I forgot to consider the Beta.

    What is Beta, and why did it affect my trade?

    In my trading experience, I usually focus on the “Zen Bull” thesis—the overall picture. But the Beta number indicates the stock’ s volatility.

    • Market Average: A Beta of 1. 1.0 means the stock moves in sync with the market.
    • Alcoa’ s Beta: AA has a Beta of 1. 7.

    This indicates Alcoa is 70% more volatile than the average stock. If the market sneezes, Alcoa catches a cold; if the market drops 1%, Alcoa could drop 1. 7%. By setting a tight stop loss on a high- Beta stock, I set myself up for a trap. The “noise” of a typical Tuesday morning was enough to trigger my exit, even though my one- month outlook was unchanged.

    The Mistake: I didn’ t give the stock enough “room to breathe.” High Beta calls for a wider safety margin.

    How to find Beta (Don’ t skip this step!)

    If you’ re using Omstock. com, avoid the same mistake. Here’ s how to find Beta before investing:

    1. Your Broker App: Many professional platforms like Interactive Brokers display Beta in the “Key Statistics” or “Instrument Details” section for any stock.
    2. Financial Sites: Visit Yahoo Finance or Google Finance, input the ticker (e. g., AA or CCJ), and find Beta listed under ” Beta (5 Y Monthly) ” on the main summary page.
    3. The “Vibe” Check: A Beta above 1. 1.5signals a “jumper”- expect larger swings.

    Moving Forward

    I won’ t let the FOMO Monkey influence me after this stop- out. I see this as a lesson for my Omstock journey. Next time, I’ ll check the Beta first and adjust my position size so I can handle a wider stop without risking too much.

    The Zen Bull remains calm, even when clipped. Onward to the next trade.

  • The 7,000 Milestone Mirage: Why the S&P 500 Breakout is Thin Air

    The 7,000 Milestone Mirage: Why the S&P 500 Breakout is Thin Air

    Watching the market open today was a lesson in institutional psychology. We saw a massive drop in the pre-market, followed by a straight-up climb at the opening bell. To the untrained eye, it looked like a recovery. To a disciplined trader, it looked like a trap.

    The Hedge Fund Whales executed a classic maneuver: they sold heavily before the bell, allowed the “headline news” of the S&P 500 hitting 7,000 to lure in retail buyers, and then used that buying pressure as exit liquidity. By the time the “FOMO Monkey” was clicking “buy” on the 7,000 breakout, the billionaires were already halfway out the door.

    1. The “Thin” Milestone

    The headlines today celebrated a historic moment as the S&P 500 hit an intraday high of 7,051.23. But price is a liar without breadth.

    • The Data: While the index hit a record, only 54.8% of S&P 500 stocks are actually trading above their 200-day moving average.
    • The Mirage: In a healthy, sustainable bull market, you want to see 70% or higher participation. Today’s rally was “thin air”—propped up by a few mega-cap giants while the average stock struggled to keep its head above water.

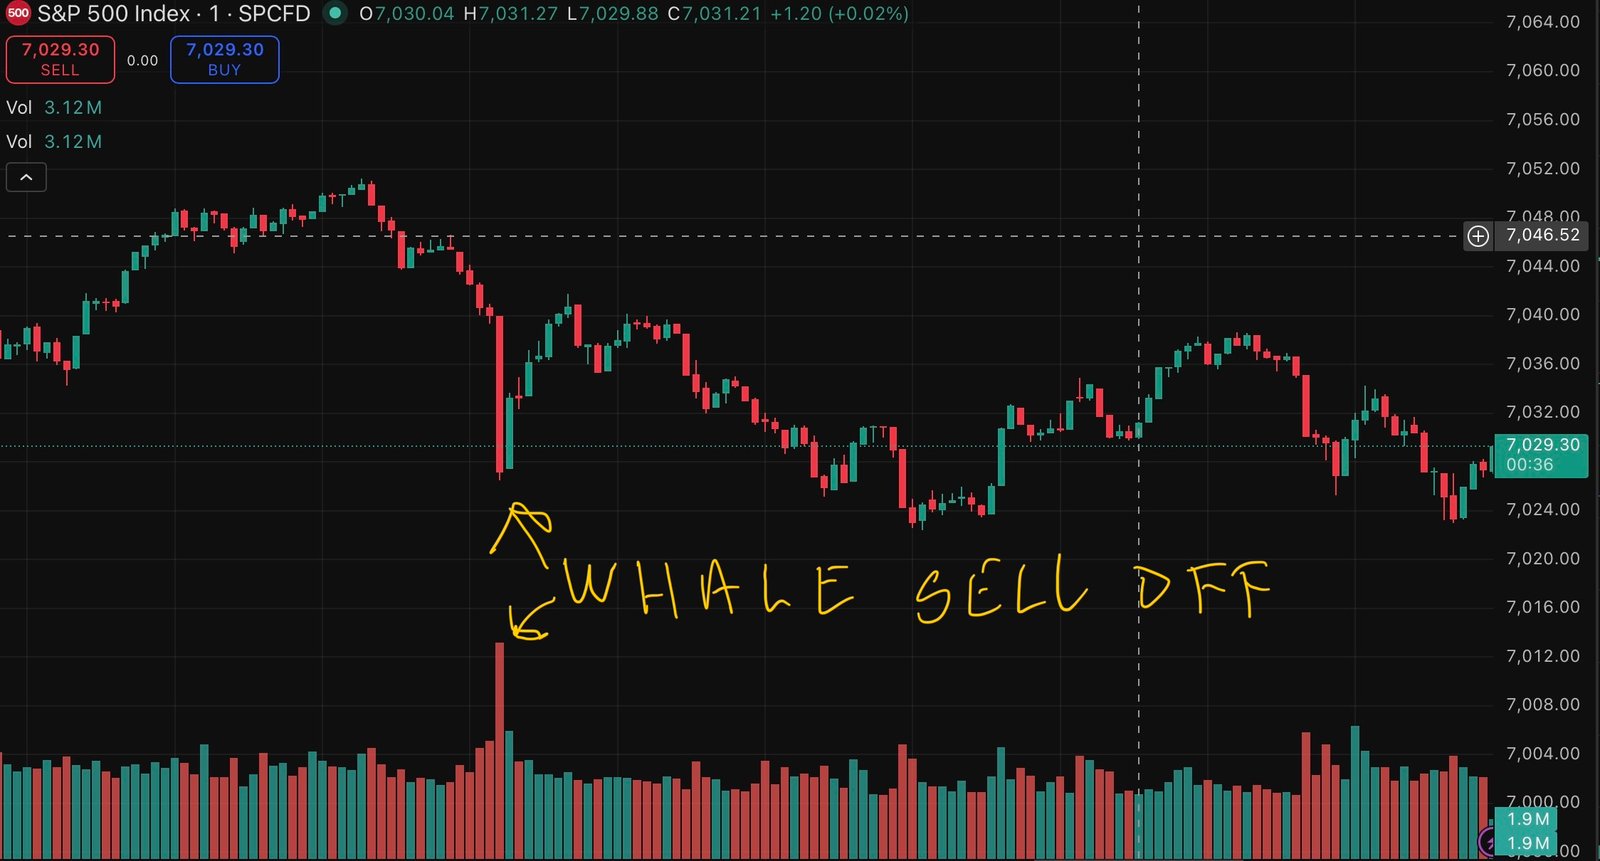
    2. The “Skyrocket and Fall”

    The market looked like a miracle at 9:30 AM and looked like a trap by 11:00 AM. The S&P 500 opened at 7,037 and immediately skyrocketed, but it lacked the institutional support to hold the high, eventually “falling strongly” to retest the 7,008 level.

    This is Distribution. Big money is feeding shares to excited retail traders who are just now reading the headlines.

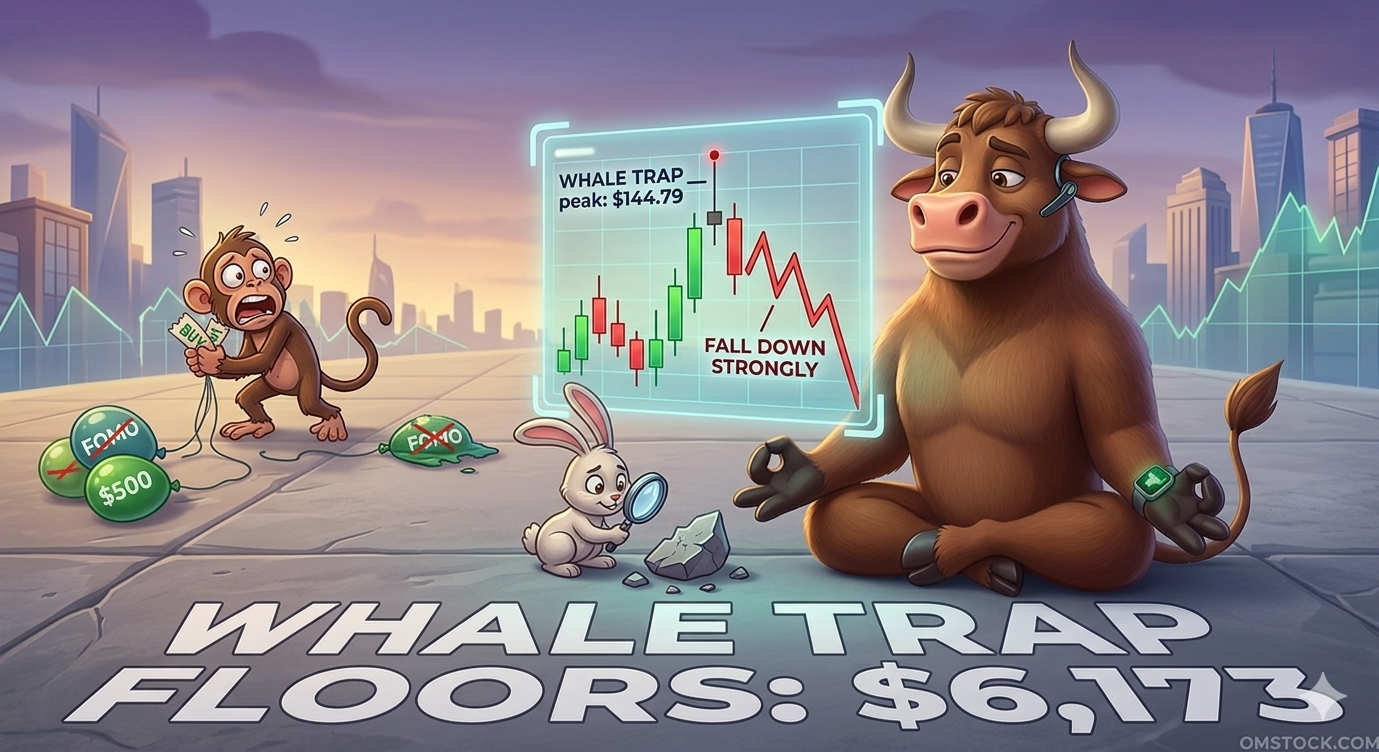
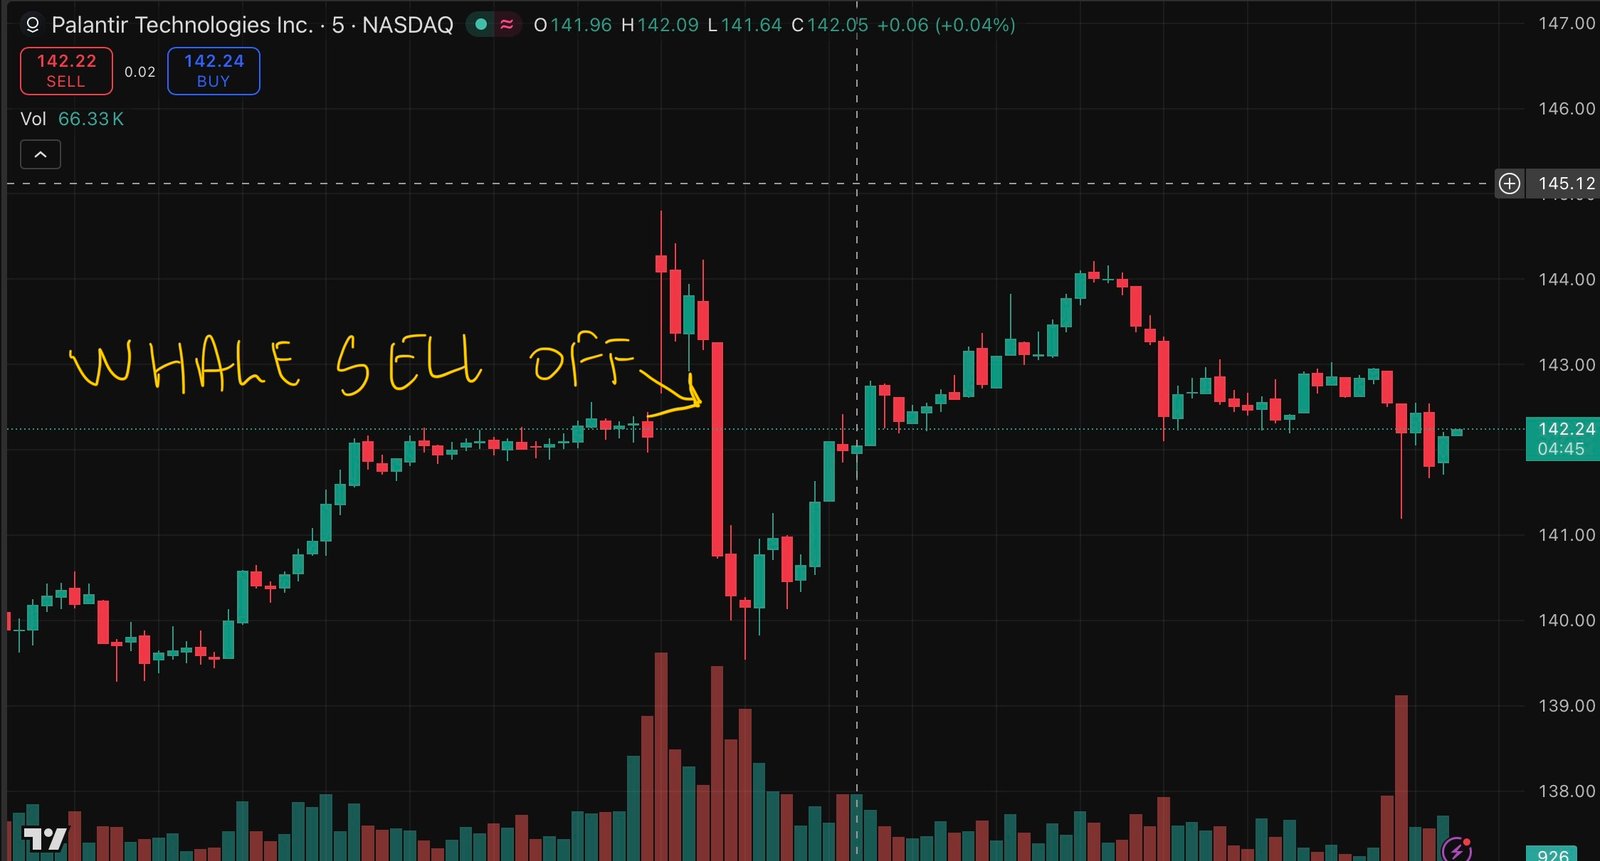
    Case Study: Palantir (PLTR)

    Palantir provided the perfect roadmap of today’s trap.

    • The Lure: It opened at $144.29, sparking a retail rush.
    • The Rejection: Within hours, it fell to $139.53.

    If you bought the “dip” at $142 because it looked “cheaper” than it was 10 minutes prior, you weren’t trading—you were being trapped. You provided the exit liquidity the Whale needed to dump their position.

    3. The Safety Net: The Crisis Floor

    The Whale starts selling long before the bell rings. By the time you see the “Skyrocket,” the trap is already set. If you are buying a 3% drop from an all-time high without checking the volume, you aren’t buying a discount—you are providing an exit for a billionaire.

    The Map Forward:

    • The Trend: The 200-day moving average for the S&P 500 is currently at 6,670.
    • The Confirmation: If this 7,000 breakout fails and we close back below the old January high of 6,978, the trap has snapped shut.

    In that scenario, we won’t be looking for a “dip” to buy; we will be looking for a fast drop back to our 6,173 Crisis Floor.

    I’m documenting every step of this trading journey here at Omstock.com. If you’re tired of chasing the FOMO Monkey and want to trade with Zen discipline, subscribe to follow my path toward the Crisis Floor and beyond.