Tag: Trading Psychology

  • Why I Sold ZIM Before Earnings—Despite the $35 Takeover Offer

    Why I Sold ZIM Before Earnings—Despite the $35 Takeover Offer

    Closing With a Calm Mind

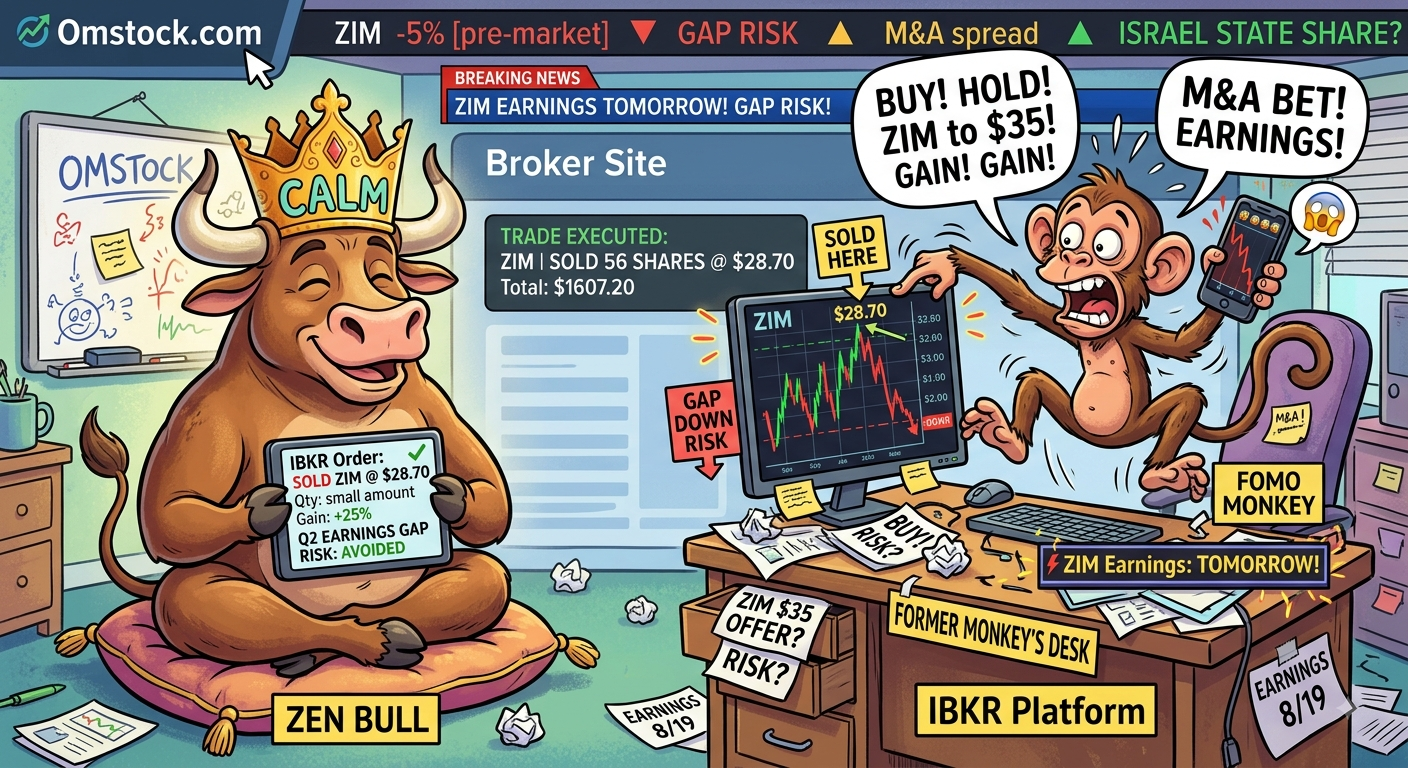
    I closed my position in ZIM Integrated Shipping Services today with a calm mind and absolute conviction.
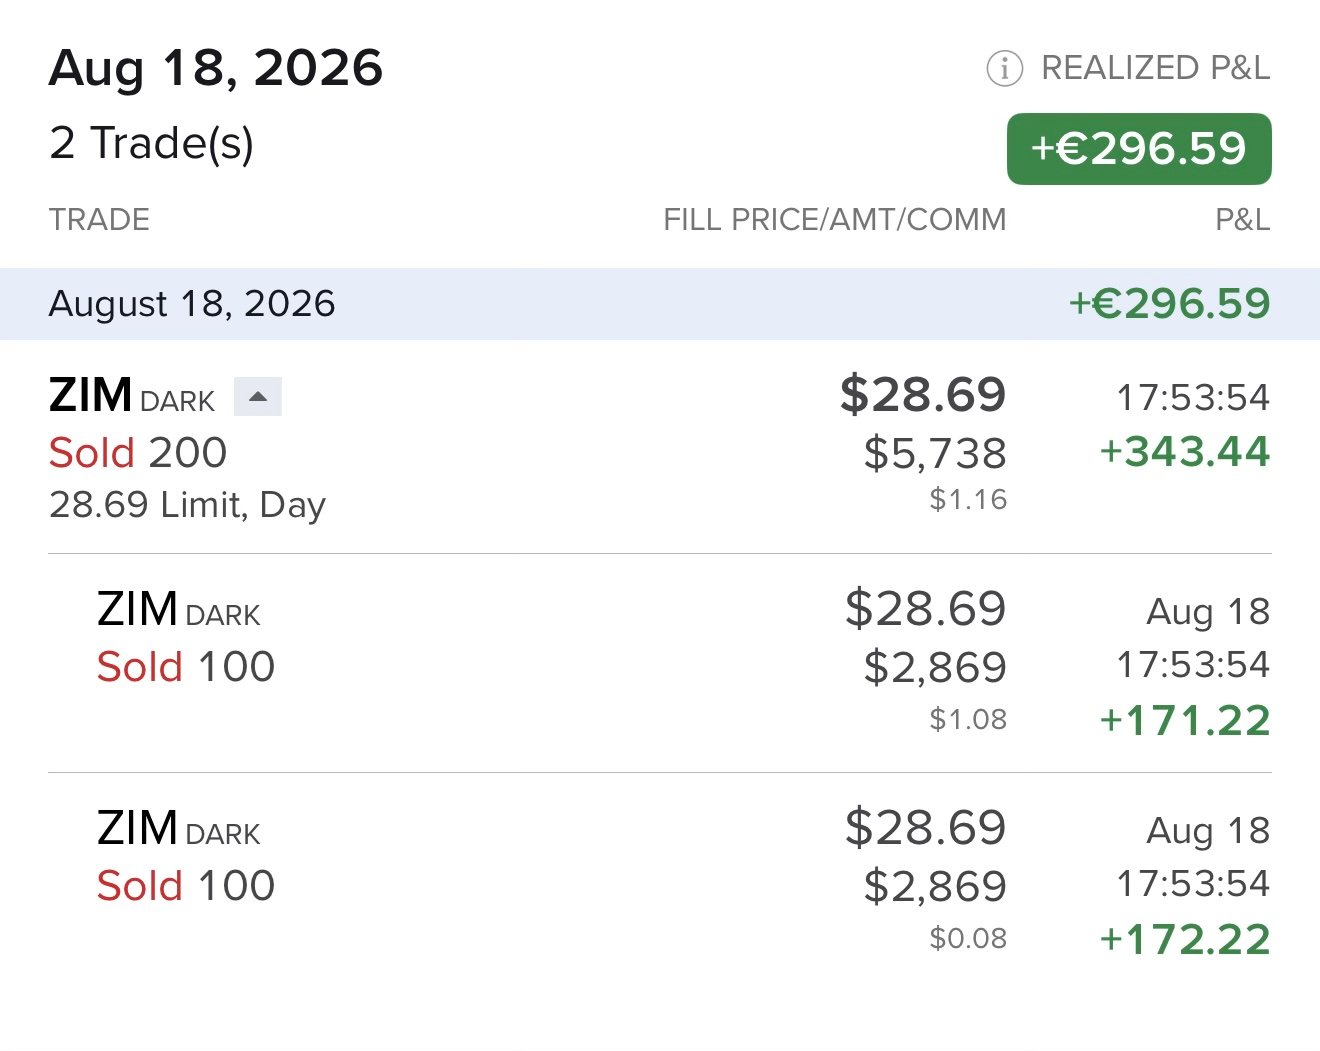
    Selling ZIM before the closing and Q2 results.
    Selling ZIM before the closing and Q2 results.

    ZIM was trading near $28.70—hovering right around its 52-week high—with a pending $35-per-share all-cash takeover offer from Hapag-Lloyd on the table. On the surface, holding seems like easy math: if the transaction closes, there is still roughly 22% ($6.30 per share) of upside remaining.

    That spread is not free money. The market leaves a discount on the table only when it prices in serious execution risk.

    1. My Original Thesis Had Dissolved

    I did not enter ZIM as a merger-arbitrage play. My original thesis was macro-driven: spot freight rates surging from geopolitical disruptions in the Middle East.

    When the buyout offer arrived, the engine driving the stock completely changed. Continuing to hold was no longer a trend trade on global logistics—it was a brand-new, binary bet on regulatory politics. Specifically, whether the State of Israel will approve or veto the deal under its strategic Special State Share (“golden share”).

    When the premise of a trade morphs into something you never signed up for, you don’t defend it on autopilot. You re-underwrite it from scratch.
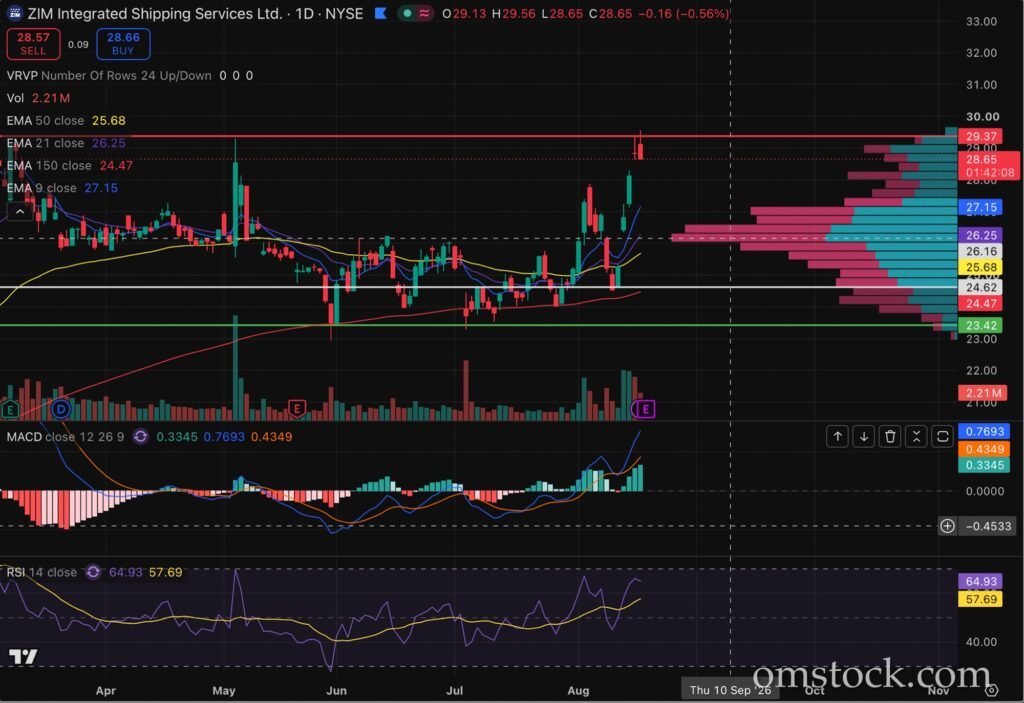
    2. Asymmetric Math: Capped Upside, Open Downside

    At $28.70, my maximum reward was capped at $35. The downside, however, has no ceiling.

    If the buyout collapses under political pushback, ZIM will instantly reprice as a standalone cyclical shipper. Standalone fundamentals offer little cushion right now: Q1 revenue fell to $1.40 billion (down from $2.01 billion YoY), posting an [latex]86 million net loss. Chasing a capped +[/latex]6.30 gain while exposing capital to a $10+ drop if the deal breaks is bad arithmetic.

    3. Binary Earnings and Overnight Gap Risk

    ZIM reports Q2 earnings tomorrow morning before the opening bell.

    A stop-loss provides execution during market hours, but it is useless against a pre-market gap down. Holding through the report meant stacking quarterly earnings uncertainty right on top of sovereign regulatory risk.

    Process Over Outcome

    Exiting does not mean I am predicting a crash. The earnings could beat expectations, regulators could greenlight the merger tomorrow, and the stock could march straight to $35.

    If it does, selling at $28.70 was still the right trade.

    Discipline is measured by the risk profile at execution, not by the hindsight regret of leaving the last dollar on the table. The position was only about $1,600, but discipline is muscle memory—sloppy habits on small accounts become catastrophic losses on large ones.

    I took profits into strength, protected my capital, and cleared mental bandwidth for the next setup.

    This is a personal trading journal entry documenting my own process, not financial advice.
  • The Cost of Listening to the Noise: A Lesson in “Paper-Handed” Stops

    The Cost of Listening to the Noise: A Lesson in “Paper-Handed” Stops

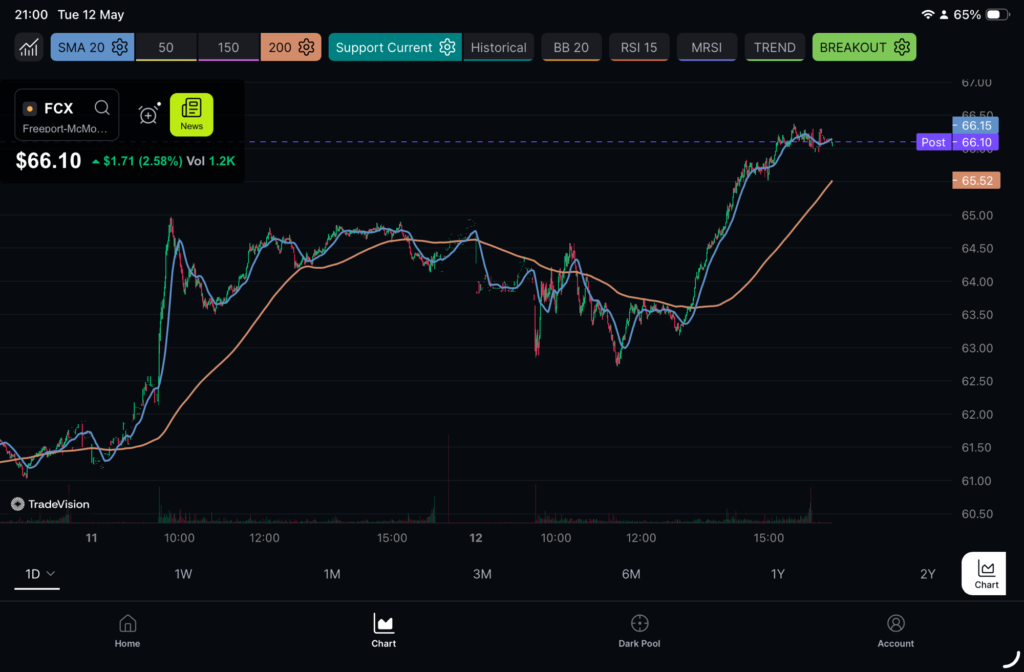
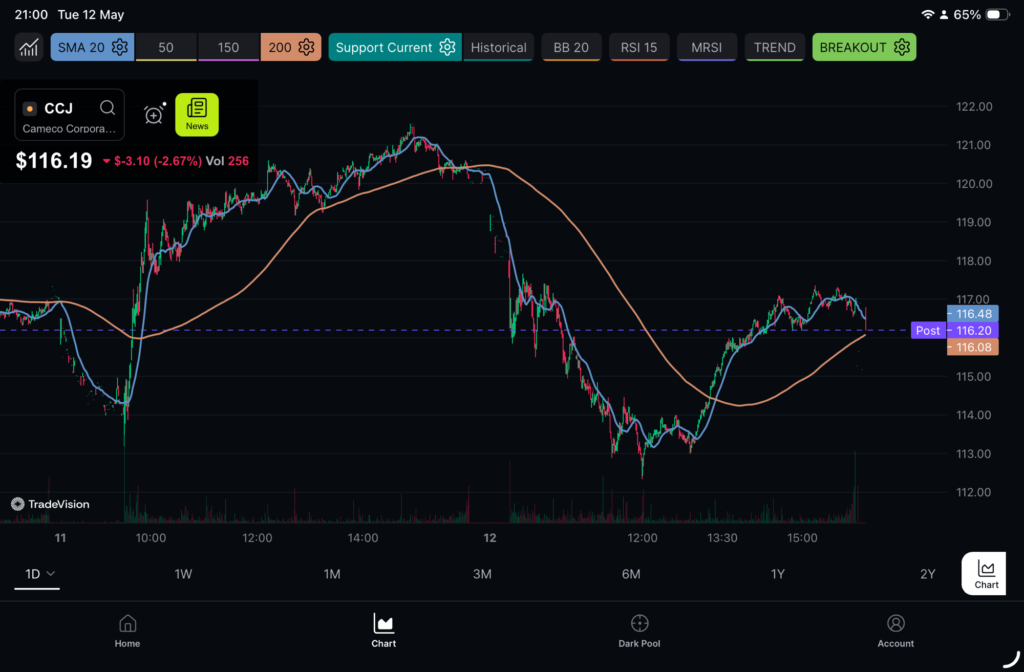
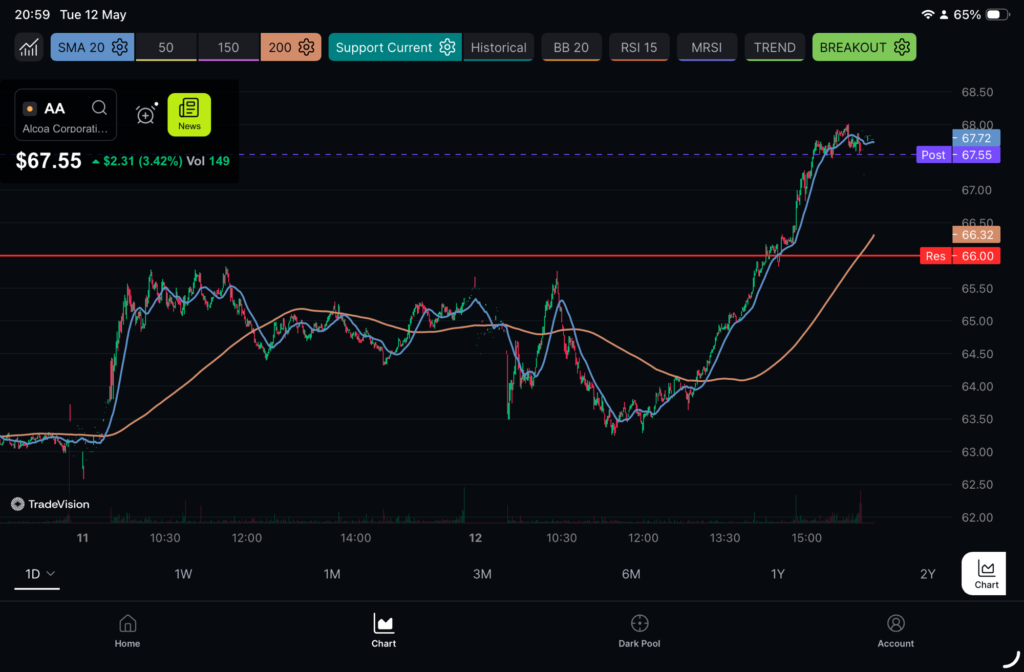
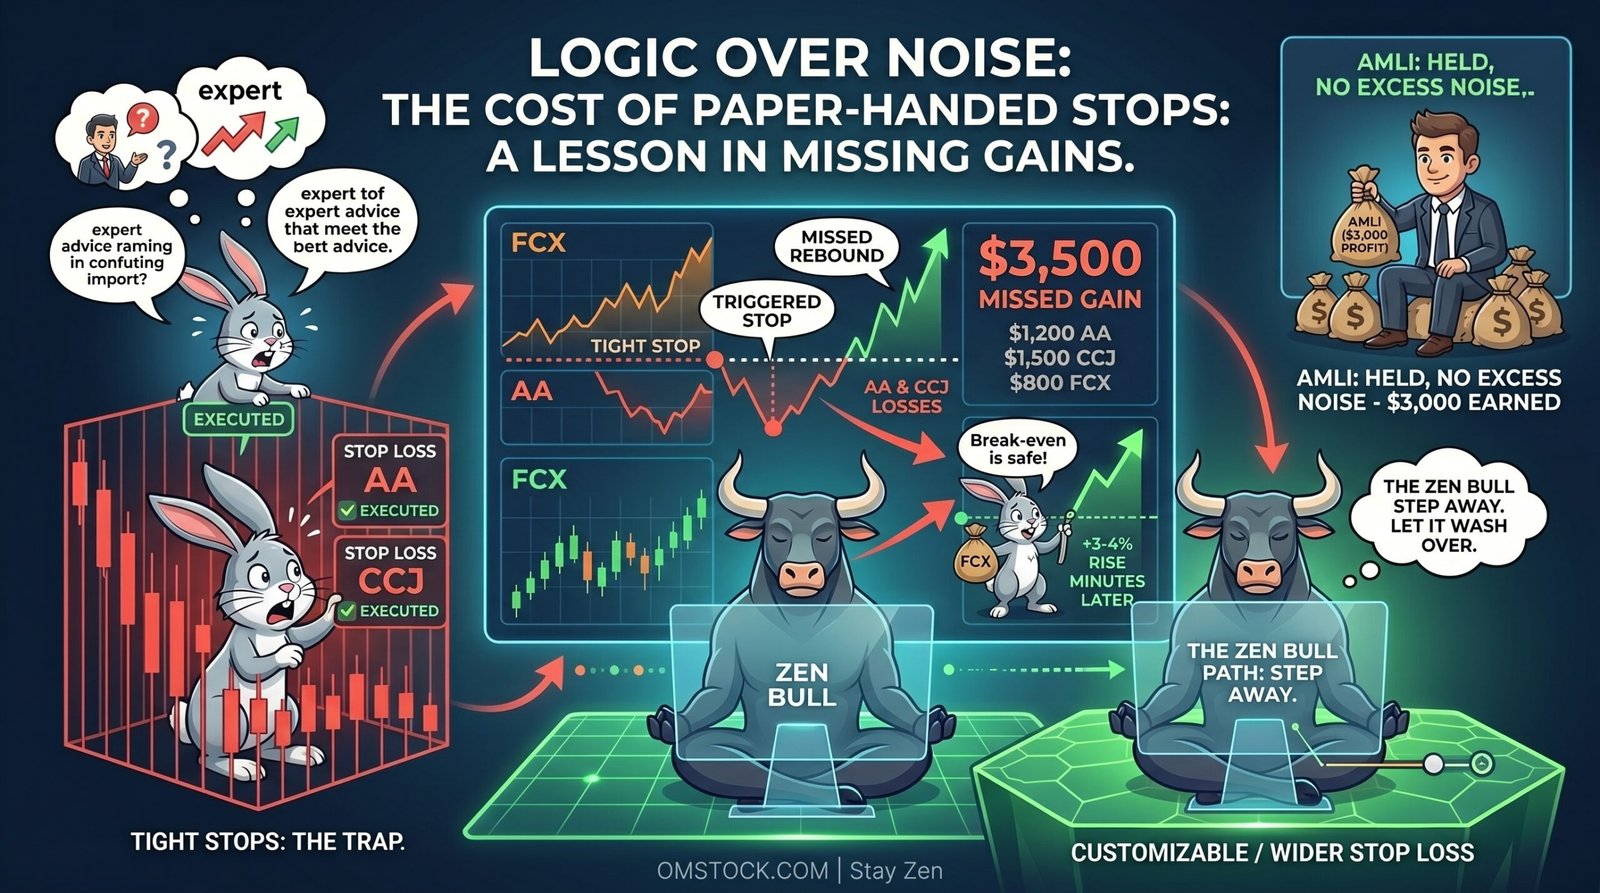
    There’s a particular pain in realizing you’re completely right about a direction, yet walking away empty-handed. That’s how I felt. I was strongly convinced about three stocks: Freeport-McMoRan (FCX), Alcoa (AA), and Cameco (CCJ). My intuition, sector research, and online sentiment all pointed toward a positive outcome. I invested $10,000 in each, expecting results within a month.

    And I was right. But I didn’t get to see the gains.

    The Trap

    Despite my instincts, I followed some “expert” advice and set my stop-losses too tight. I thought they knew better than me. I let the Paper-Handed Rabbit take control, creating a cage so small the trades couldn’t breathe.

    • Alcoa (AA): Hit the tight stop early, exiting with a loss before the trend even began.
    • Cameco (CCJ): This one hurt the most — it dipped sharply, triggered my stop, then rebounded quickly. I watched from the sidelines as it soared without me.
    • Freeport (FCX): The only winner, showing a profit. But frustration with the others led me to sell just to break even.

    Minutes later, Freeport rose 3–4%.

    The Math of Frustration

    Had I not let those “experts” convince me to keep stops narrow, I’d be up $3,500 now. Instead, I’m even. Initially, that $3,500 would have been a huge boost, especially during slow work periods.

    It’s ironic. I started trading Amaroq Minerals (AMLI)—a junior gold miner in Greenland—without knowing much, through a local bank. I simply held on, invested $10,000, and earned $3,000 in a month. Back then, I didn’t “know too much.” Now, I thought I did, and the FOMO Monkey and external advice clouded my judgment.

    The Path Forward

    It’s disappointing and heavy. But instead of revenge trading or battling the market, I’m choosing the only path a Zen Bull takes: stepping away for a day or two. I’ll sit with my emotions, let them wash over me, stay with them, and release them when I’m ready. The market will still be here. Right now, I need to regain my conviction and quiet the outside noise.

    Stay Zen.

  • The Mystery of the “Jumping Stock Price” 📈🧙‍♂️

    The Mystery of the “Jumping Stock Price” 📈🧙‍♂️

    Have you ever looked at a price tag at the store, but when you got to the register, the cashier told you it actually cost $10 more? That’s kind of what’s happening in this screenshot:

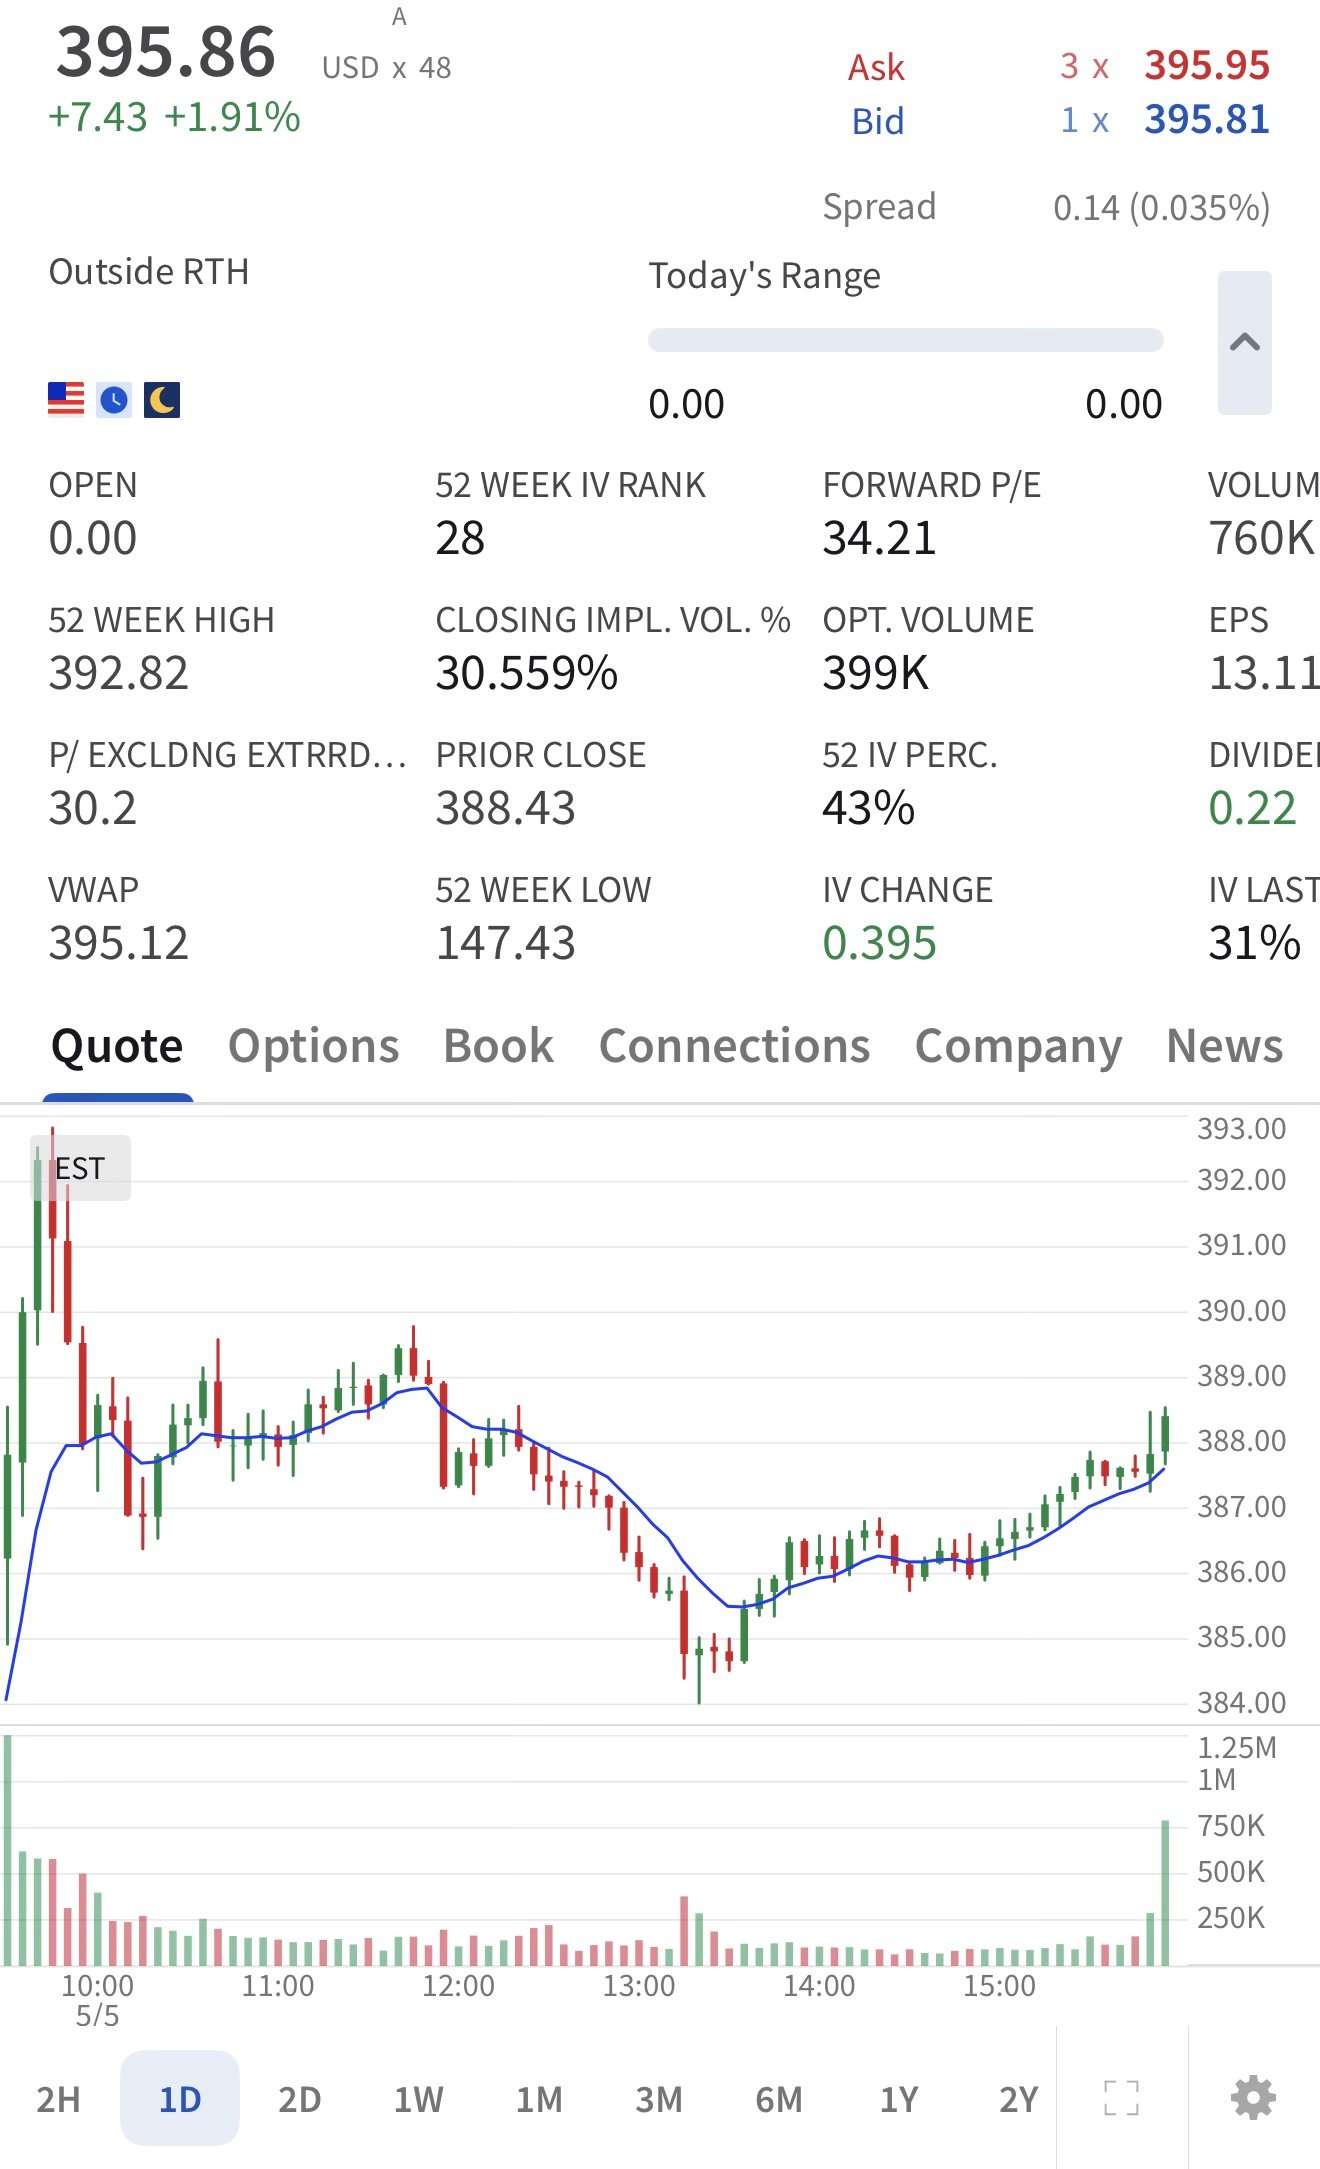
    A screenshot from Interactive Brokers shows you the gap in prices and the prices on the chart.
    A screenshot from Interactive Brokers shows you the gap in prices and the prices on the chart.

    Here is the breakdown of why the numbers look like they are playing a prank on us:

    1. The “Ghost Market” (After-Hours) 👻

    Most people think the stock market only works from 9:30 AM to 4:00 PM. But there’s actually a “secret” session called Extended Hours. In image.png, you can see a tiny label that says “Outside RTH”. This means the “Regular” market is closed, but a few people are still trading in the dark.

    2. The Big Jump (The “Gap”) 🚀

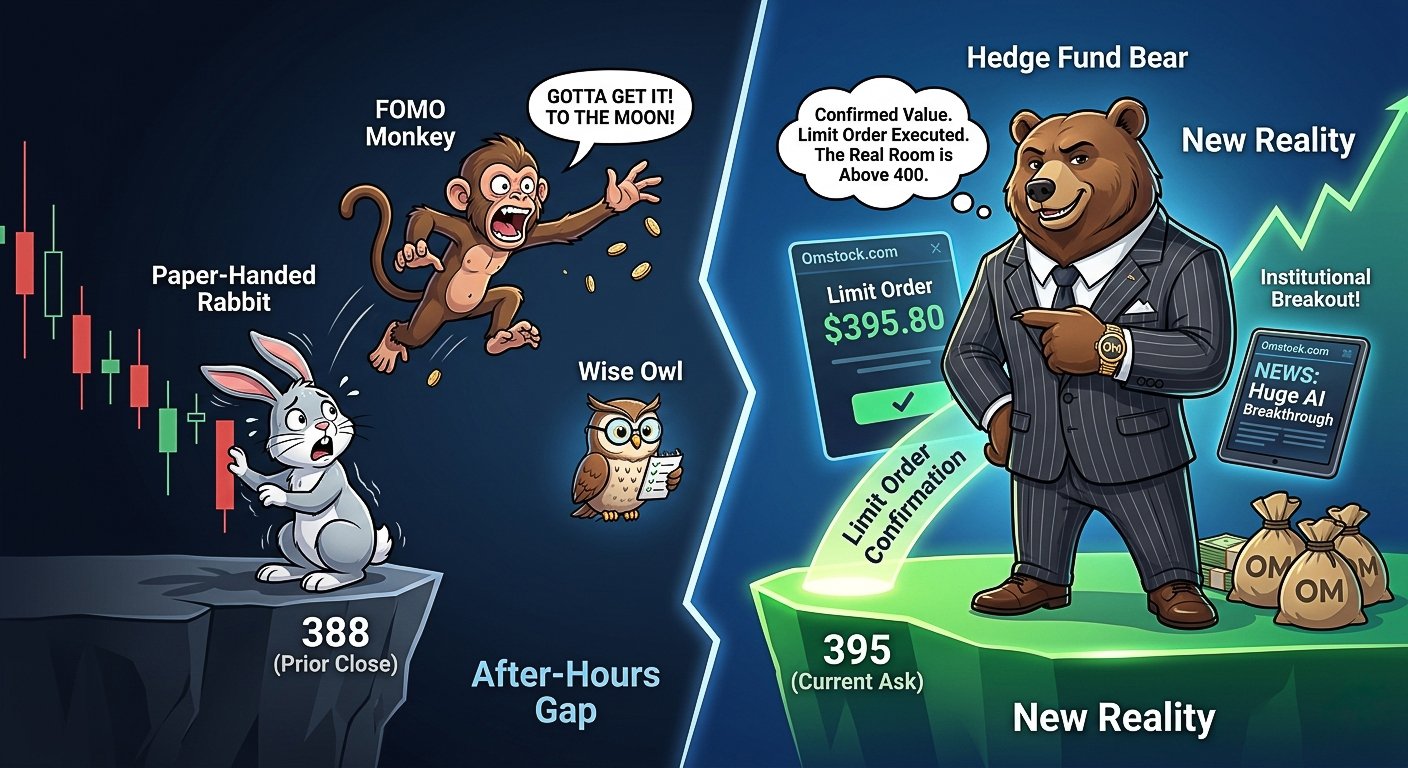
    On the chart, the price looks like it’s around 380 or 388. But the big number at the top says 395.86.

    • Imagine a video game character standing on a ledge at level 388.
    • Suddenly, while the game is “paused” overnight, the character teleports up to level 395.
    • The chart hasn’t drawn the new line yet because the official game hasn’t restarted! This is called a Gap Up.

    This chart is lagging behind. It visually ends at the Prior Close of around 388. It is still displaying the

    3. Should You Buy Right Now? 🛒

    It might seem like a bad deal to buy at 395 when the chart says 380, but here’s the deal:

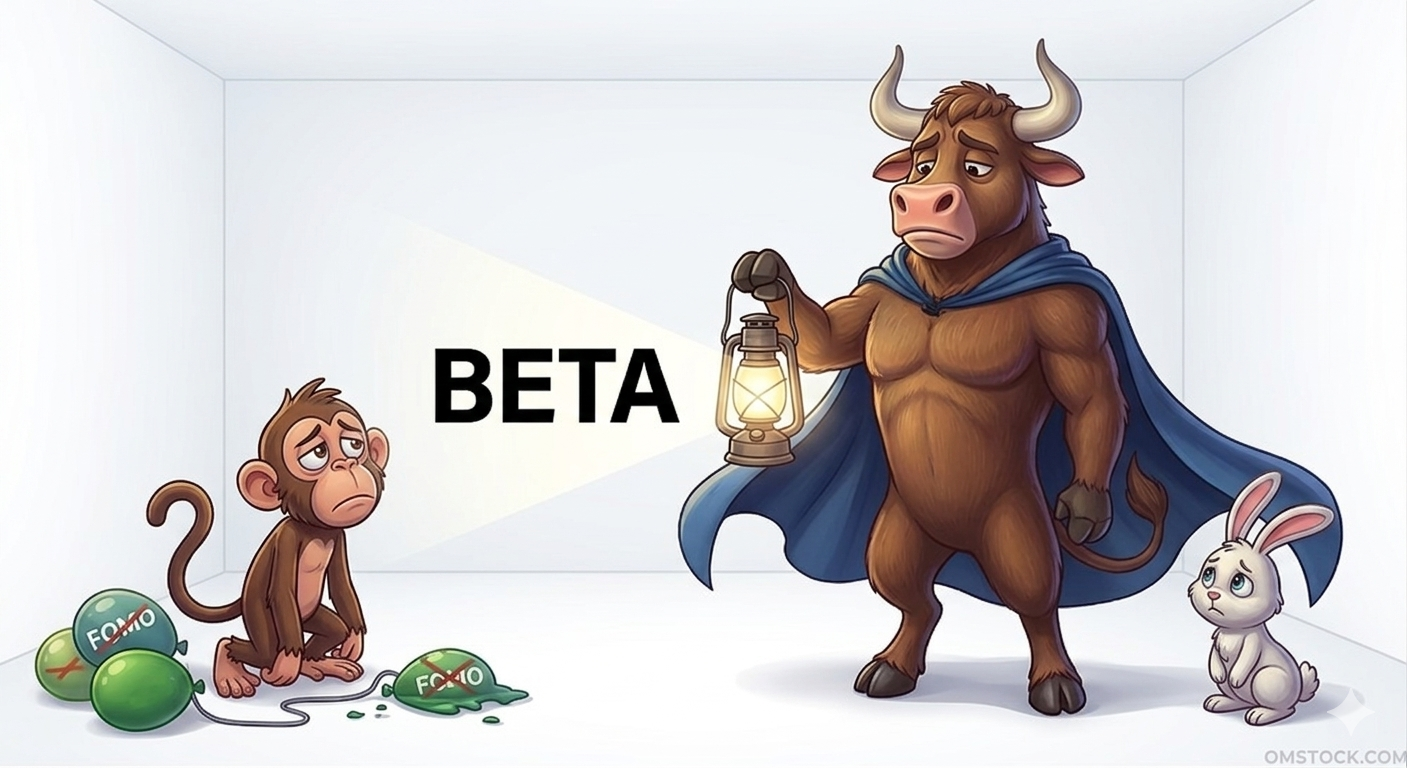
    • The FOMO Monkey 🐒: This character wants to jump in right now because they’re afraid the price will hit 400 or 500 by morning. They don’t care if they pay a little extra!
    • The Zen Bull 🐂: This character stays calm. They know that sometimes, when the market officially opens at 9:30 AM, all the excitement dies down and the price might drop back toward the old chart price.

    4. Can You Even Trade Now? 🛑

    You can, but you have to use a Limit Order. That’s basically telling the computer: “I will only buy this if the price is exactly X dollars.” If you just try to buy it normally, the computer might get confused because the “official” price is still being decided.

    The Lesson: Just because the chart shows one thing doesn’t mean that’s the price you’ll get! Always check the Ask (the seller’s price) and the Bid (the buyer’s price) before you hit that “Buy” button on Omstock.com.

    Why the “Pros” Might Buy at 395 🐳

    Even though the price jumped from 388 to 395, professional traders aren’t always just “chasing” the price. They might be buying because:

    • The “News” is Huge: Professionals might see a news report (like a big tech breakthrough) and realize that while 395 feels expensive compared to 380, the stock is actually worth 450. They want to get in before the rest of the world wakes up at 9:30 AM.
    • Arbitrage (The Price Matchers): Sometimes a stock is trading at different prices on different exchanges. Pros use super-fast computers to buy at the lower price and sell at the higher one instantly to pocket the difference.
    • Hedge Fund Math: A big “Whale” might need to buy millions of shares. They know that if they wait until the official opening bell, there will be so much “noise” and competition that they might end up paying even more than 395.
    • The “Breakout” Signal: On a chart, 395 might be a “Resistance” level. To a pro, if the price breaks above that level in after-hours, it’s a signal that the stock is now “unstoppable” and ready to fly.

    The Pro Secret: They aren’t guessing. They use advanced tools to see how many people are waiting to buy and sell behind the scenes. While the Paper-Handed Rabbit is scared of the jump, the pro sees it as a door opening to a much bigger room!

  • The “Zen Bull” Gets Clipped: A Lesson in Beta and “Noise”

    The “Zen Bull” Gets Clipped: A Lesson in Beta and “Noise”

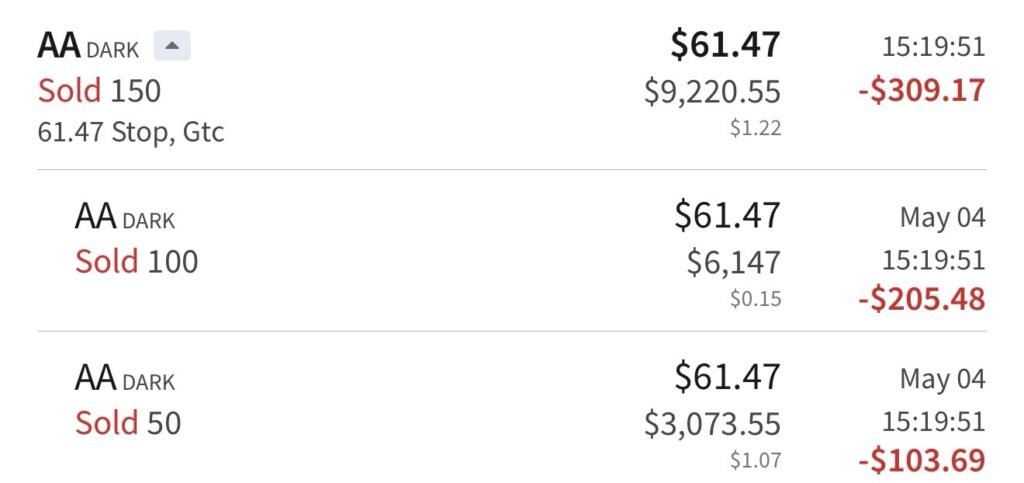
    Sometimes, the market has a way of checking your ego, and yesterday, it handed me a classic lesson. I was stopped out of my Alcoa (AA) position, and in hindsight, it was a mistake on my part. Not because the trade idea was poor, but because I overlooked the “math of the swing.”

    I was betting on a one- month recovery but set my stop loss as if I were trading a slow- moving utility stock. I forgot to consider the Beta.

    What is Beta, and why did it affect my trade?

    In my trading experience, I usually focus on the “Zen Bull” thesis—the overall picture. But the Beta number indicates the stock’ s volatility.

    • Market Average: A Beta of 1. 1.0 means the stock moves in sync with the market.
    • Alcoa’ s Beta: AA has a Beta of 1. 7.

    This indicates Alcoa is 70% more volatile than the average stock. If the market sneezes, Alcoa catches a cold; if the market drops 1%, Alcoa could drop 1. 7%. By setting a tight stop loss on a high- Beta stock, I set myself up for a trap. The “noise” of a typical Tuesday morning was enough to trigger my exit, even though my one- month outlook was unchanged.

    The Mistake: I didn’ t give the stock enough “room to breathe.” High Beta calls for a wider safety margin.

    How to find Beta (Don’ t skip this step!)

    If you’ re using Omstock. com, avoid the same mistake. Here’ s how to find Beta before investing:

    1. Your Broker App: Many professional platforms like Interactive Brokers display Beta in the “Key Statistics” or “Instrument Details” section for any stock.
    2. Financial Sites: Visit Yahoo Finance or Google Finance, input the ticker (e. g., AA or CCJ), and find Beta listed under ” Beta (5 Y Monthly) ” on the main summary page.
    3. The “Vibe” Check: A Beta above 1. 1.5signals a “jumper”- expect larger swings.

    Moving Forward

    I won’ t let the FOMO Monkey influence me after this stop- out. I see this as a lesson for my Omstock journey. Next time, I’ ll check the Beta first and adjust my position size so I can handle a wider stop without risking too much.

    The Zen Bull remains calm, even when clipped. Onward to the next trade.

  • Transitioning from Scalps to Swings: The 8-Day Road Strategy

    Transitioning from Scalps to Swings: The 8-Day Road Strategy

    The Pivot

    “For the next eight days, I’ll be on the road for work. In this business, if you can’t give the 5-minute chart your 100% focus, the mechanical ‘One Candle’ scalping method stays on the shelf. Instead of sitting out, I’m shifting my capital into the Ross Givens ‘Insider’ Swing Method.”

    Leaving the FOMO Monkey and Paper-Handed Rabbit Behind

    “Trading while traveling is the ultimate test of mindset. To make this work, I have to leave two characters behind at the trailhead:

    • The FOMO Monkey: When I’m away from the screen, the Monkey wants to whisper that I’m ‘missing the big move’ or that I should chase a price because an alert went off. I don’t listen. My ‘Buy Stop’ orders are already set. If the market doesn’t come to my price, I don’t chase the market.
    • The Paper-Handed Rabbit: When you aren’t staring at every tick, it’s easy to get spooked by a minor pullback and jump out of a trade too early. The Rabbit lives in fear. On this trip, I trust the ‘Insider Floor.’ My stop losses are hard-coded. I let the trade breathe while I focus on the road.”

    The Logic: Following the Smart Money

    “I’m looking for the ‘Coiled Spring’—stocks trading at a low level where the people running the company are buying with their own money. I’ve identified IBM, CSPI, and TLSI as the primary watches. By setting ‘Buy Stop’ orders above the current consolidation zones, I ensure the market proves it’s ready to break out before I risk a dime.”

    The Preparation

    “Being on the road requires a different kind of discipline. To keep my focus sharp and my energy steady, I’m sticking to high-protein, low-GI fuel like peanuts. It provides the long-burn energy needed for the day and the magnesium needed for recovery at night.

    Stabilize the body, and the trades follow. No Monkey, no Rabbit—just the Zen Bull.”

  • Riding the Waves and Finding Stillness in the Dips

    Riding the Waves and Finding Stillness in the Dips

    The market must breathe before it can run. Don’t let a micro-movement steal your macro-conviction.

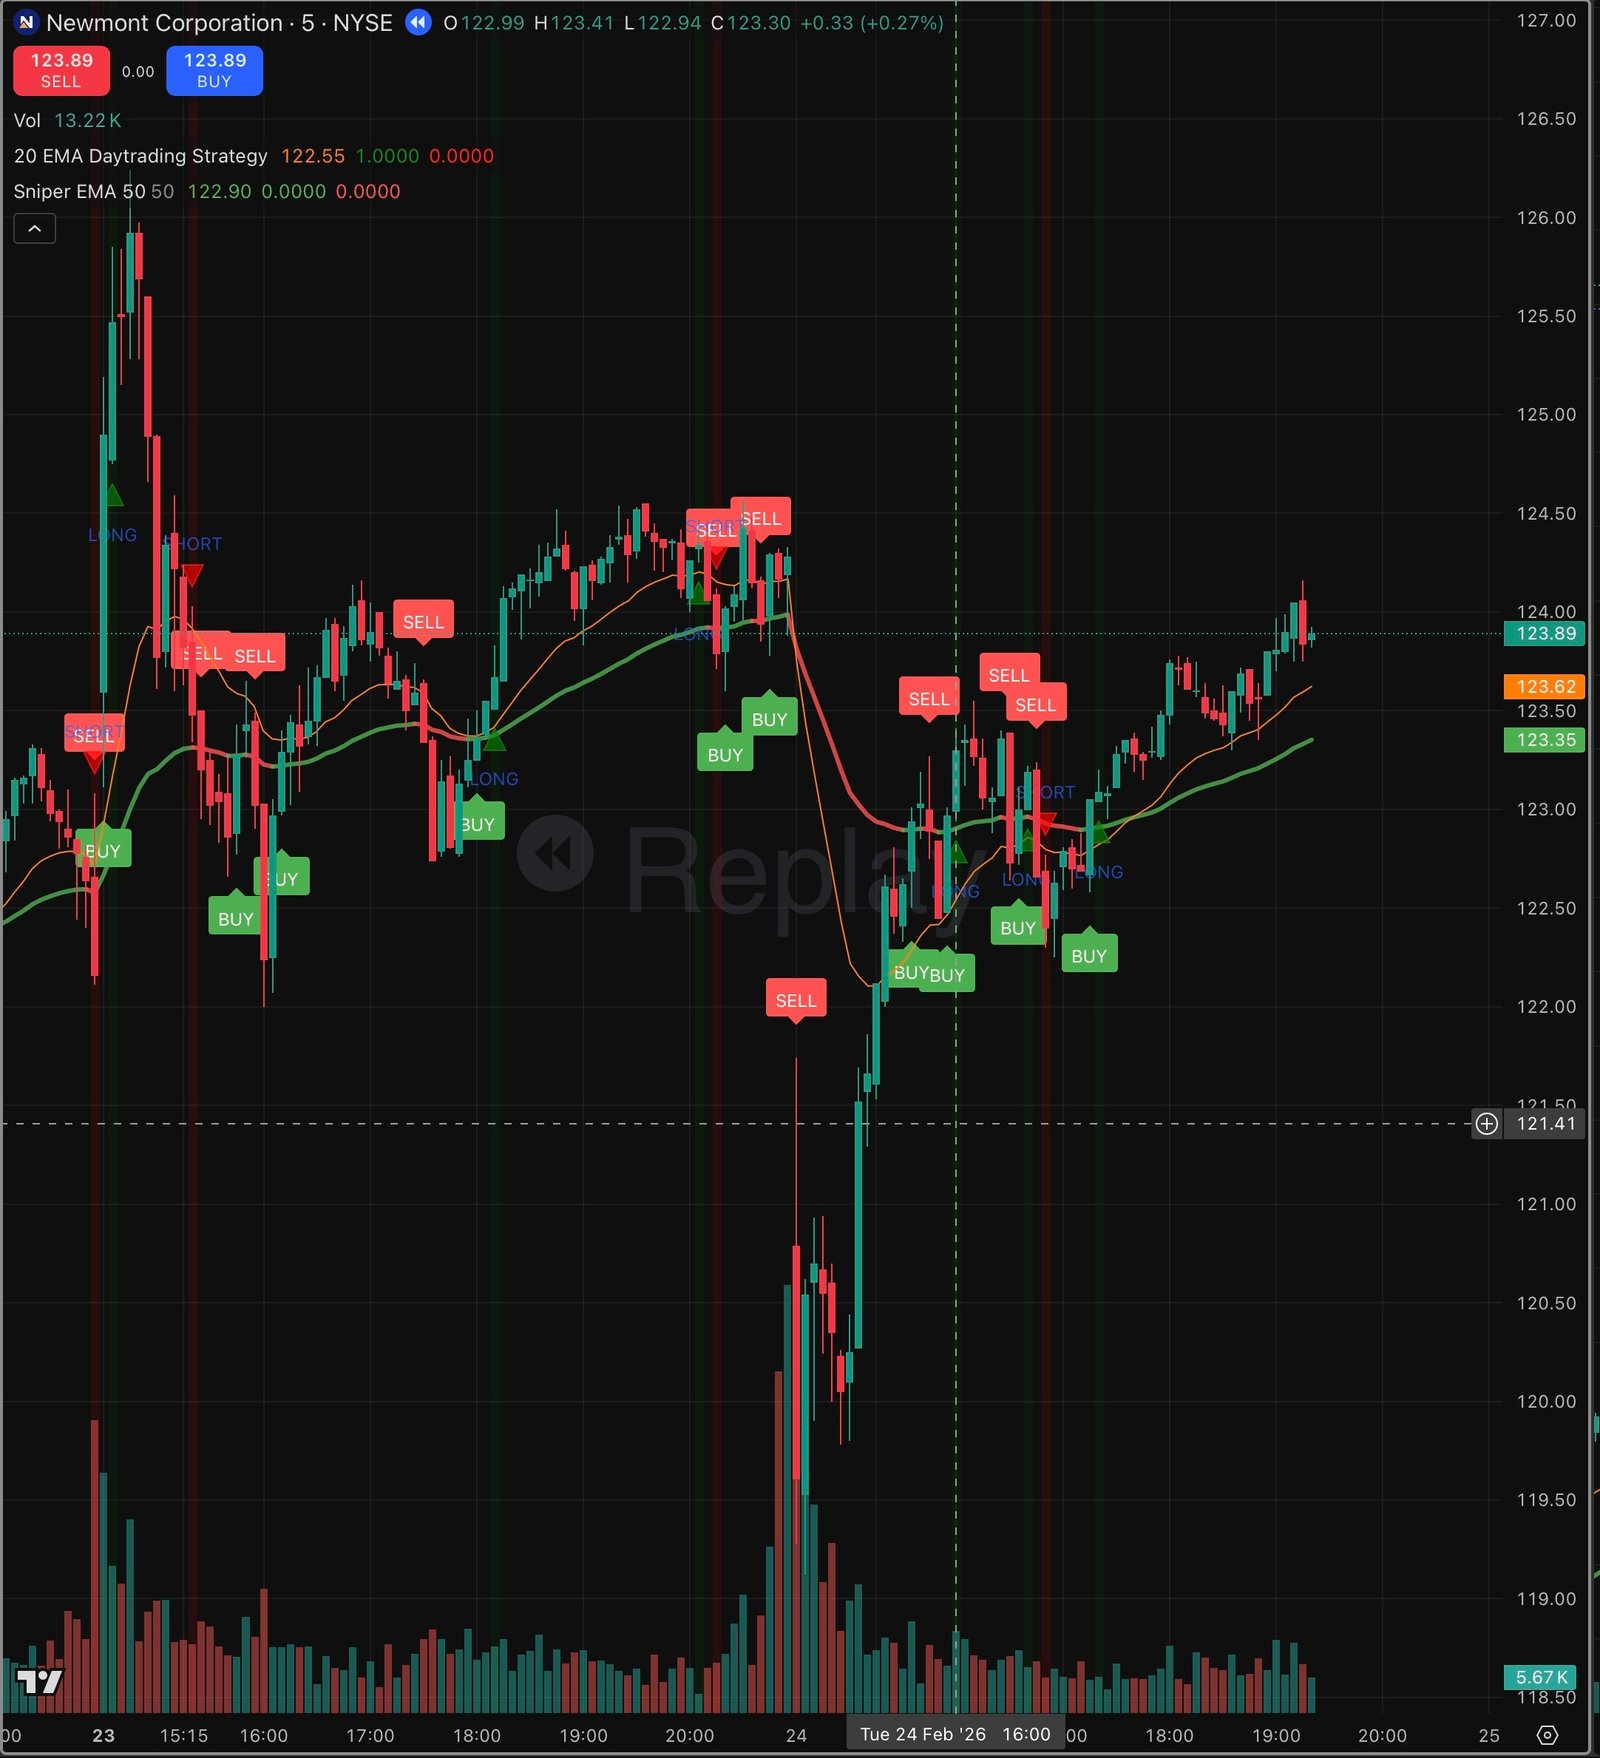
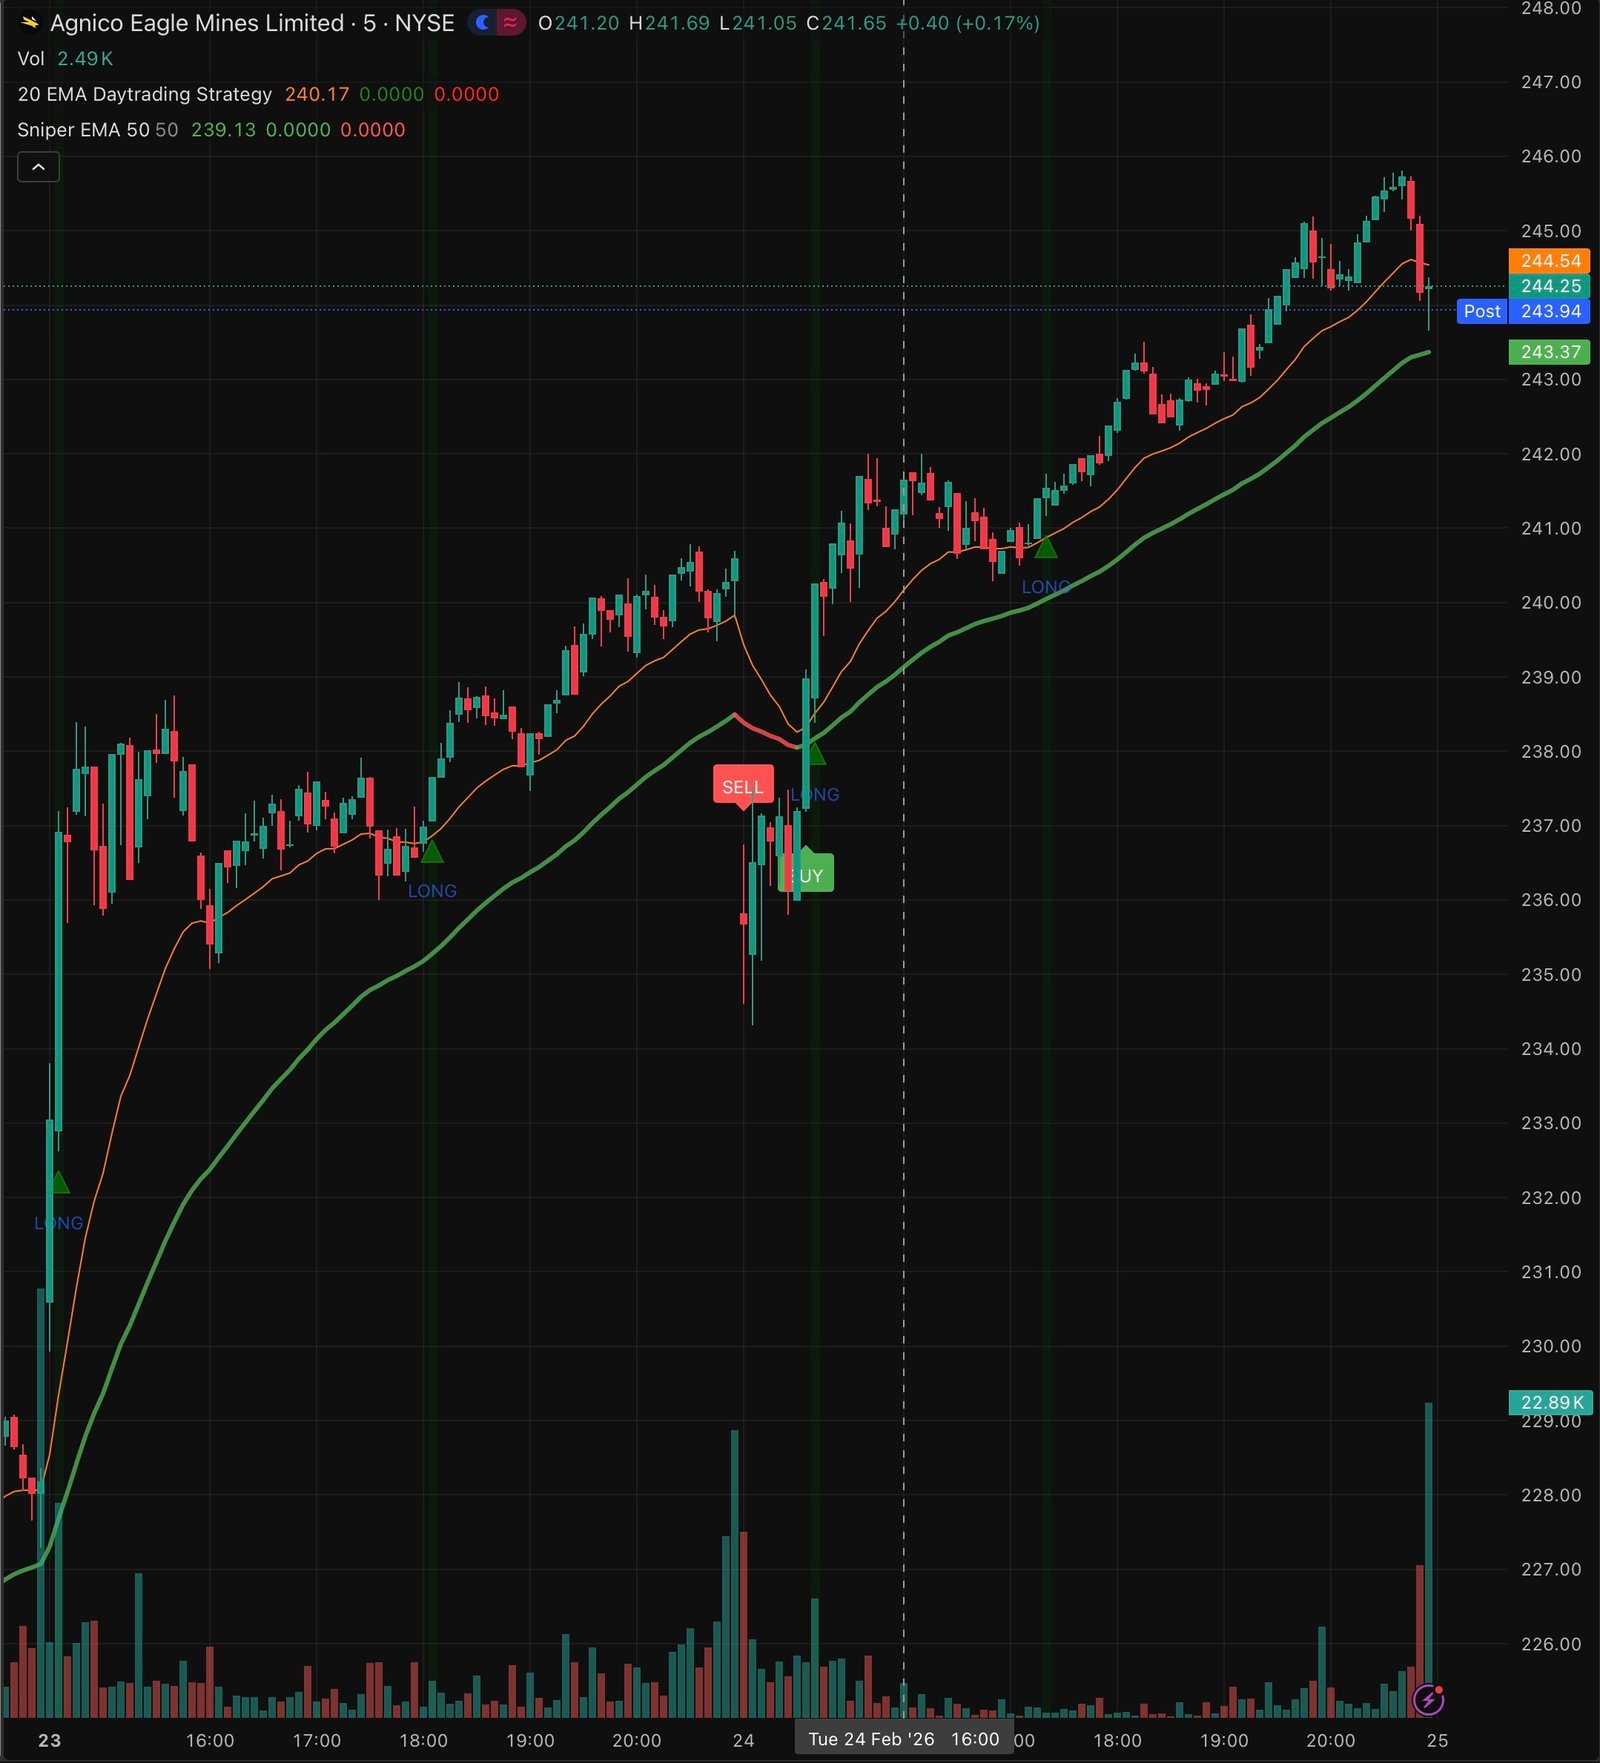
    I was looking at two charts yesterday that I’d traded the day before. I’d walked away with a modest profit from day trading, but seeing them rise again—mimicking the previous day’s gains—hit me with a flicker of regret. I’d missed the second wave. It’s clear these assets are in a “wavy” cycle right now.

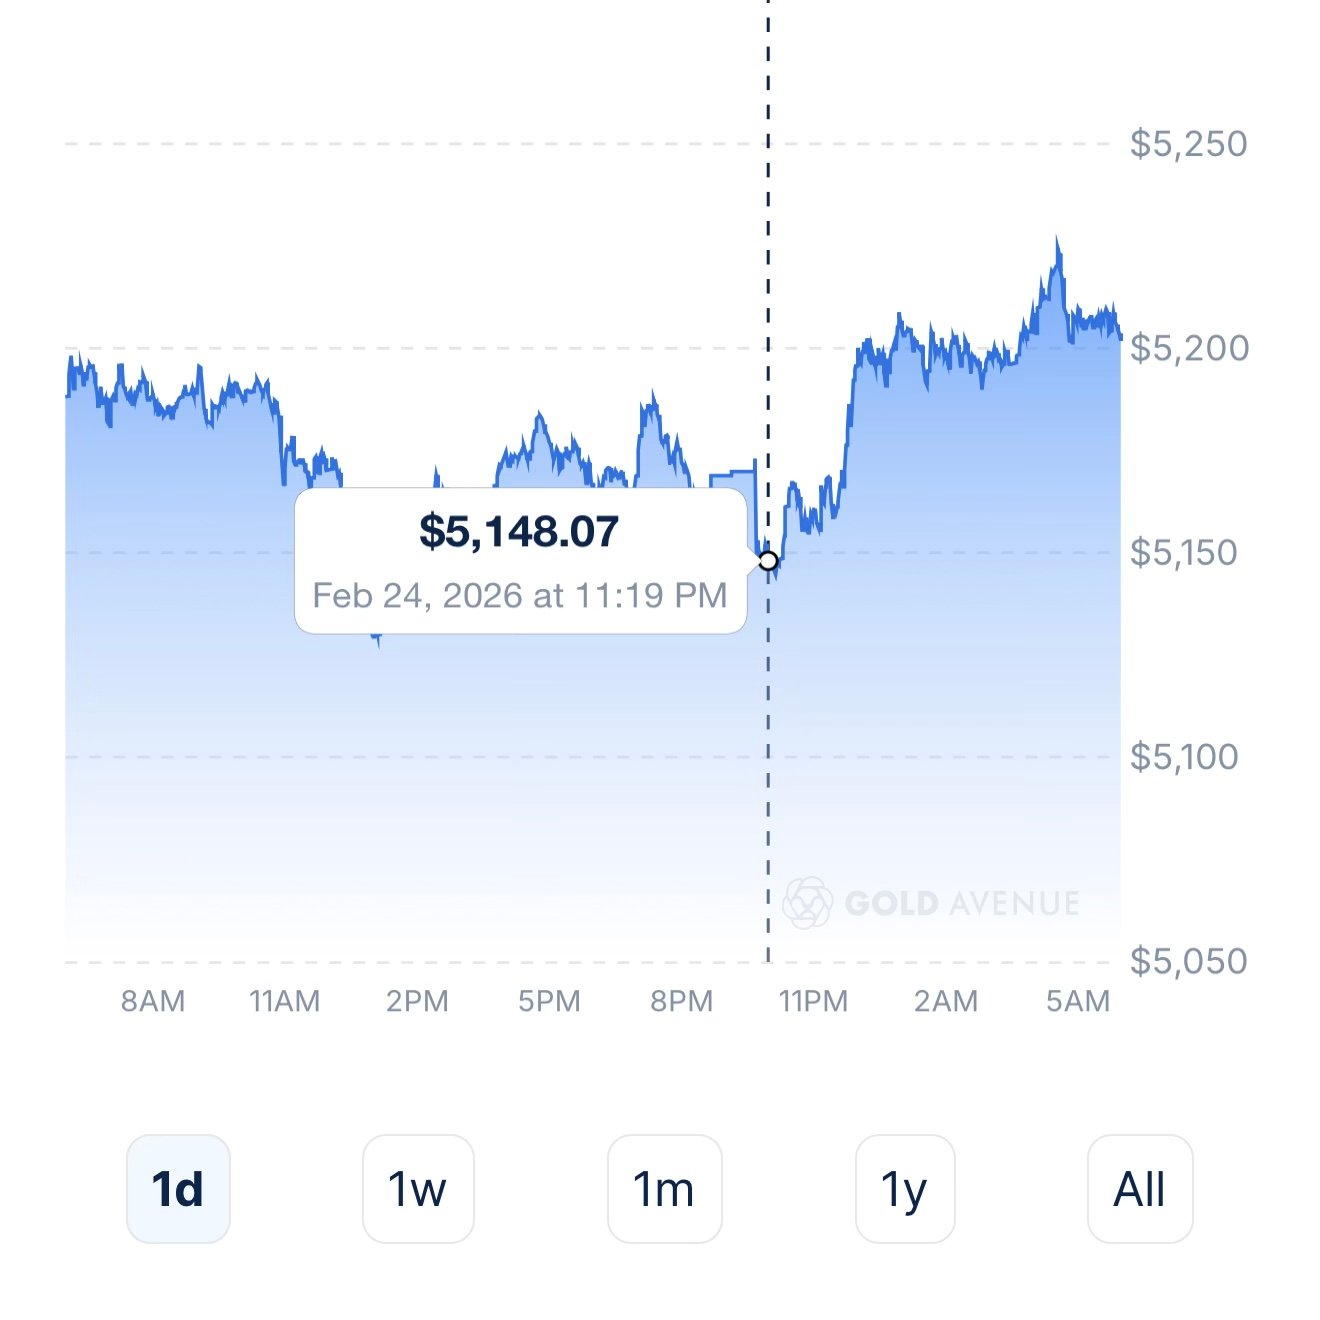
    Then, I turned my attention to gold. My mentor’s thesis is clear: gold is headed up, and when it moves, it will pull the mining companies with it. But in the moment, gold dipped. Even though I believe in the long-term play and the global tensions supporting it, that small downward swing sparked a moment of unease. I found myself questioning: Is it going lower? Did I miss something?

    Gold eventually recovered and moved back up, but the experience was a reminder of how easily micro-movements can affect your psychology. This is where awareness becomes the ultimate tool. Even when you have skin in the game and a firm belief in the asset, those small swings can still reach you. The challenge isn’t just predicting the market; it’s defending your peace of mind against the noise.

    The Zen Bull’s Lesson: How to Defend Your Peace

    If you find yourself feeling that “uneasiness” during a minor dip, here is how to stay grounded:

    • Zoom Out: Micro-movements are just the market breathing. If your long-term thesis (the global tension) hasn’t changed, the price wiggle shouldn’t change your mood.
    • Identify the Characters: Is the FOMO Monkey telling you that you’re losing out? Is the Paper-Handed Rabbit trying to make you jump too early? Recognizing these internal voices takes away their power.
    • The Cost of Admission: Volatility is the price we pay for the eventual “shoot up.” You cannot have the peak without sitting through the valley.
    • Label the Feeling: Instead of saying “I am worried,” say “I am observing a feeling of worry.” This small shift in awareness keeps you from acting impulsively.